Chapter 5 Results
Question 1: Which positions of authority lead to Fake & Factual information? Which party tends to spread Fake News more?
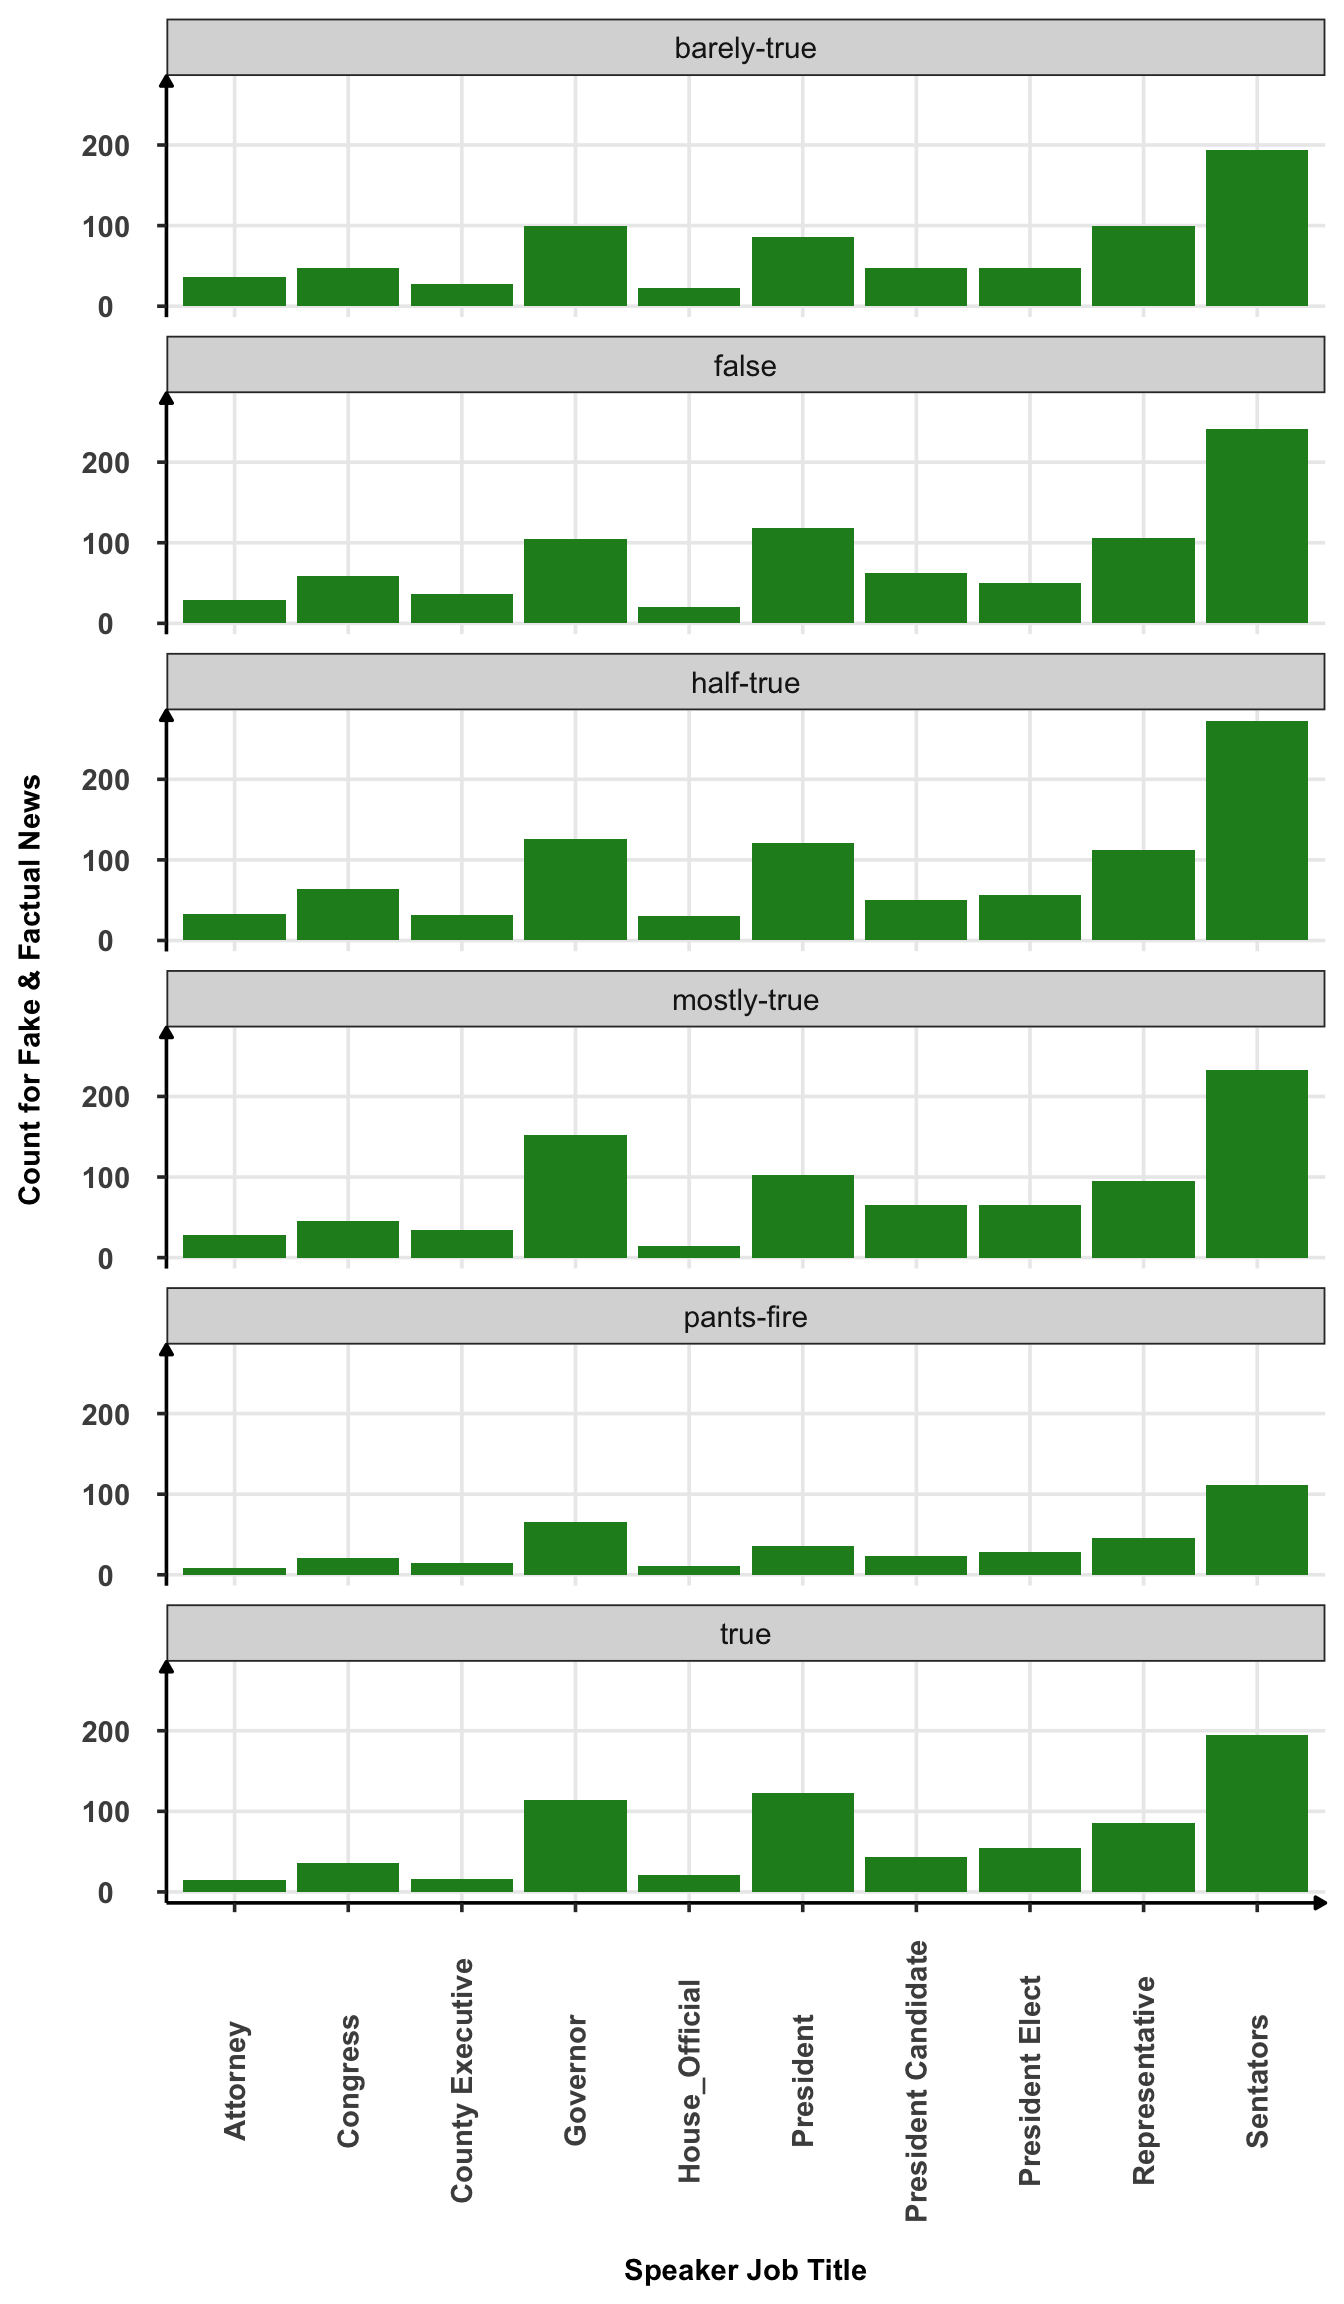
Observation from Graph 1.1
President, Governor and Senators spread the most news in all categories of truthfulness.
The “President Elect” & “President Candidate” had very similar news counts throughout the truthfulness spectrum
Senators from the Party lead the count for spreading information, for both Factual & Fake. The graph also demonstrates highest pants-fire count for Senators, demonstrating that they spread the most ridiculous claims out of all job titles in the graph.
For all job titles, the counts for mostly-true news were higher than true news.
House Officials have had the least counts in spreading Fake or Factual News.
The total count for pants-fire, false, barely-true, and half-true news is higher than the total count for mostly-true and true news, signifying that almost all job titles in the graph are associated with a high proportion of Fake News.
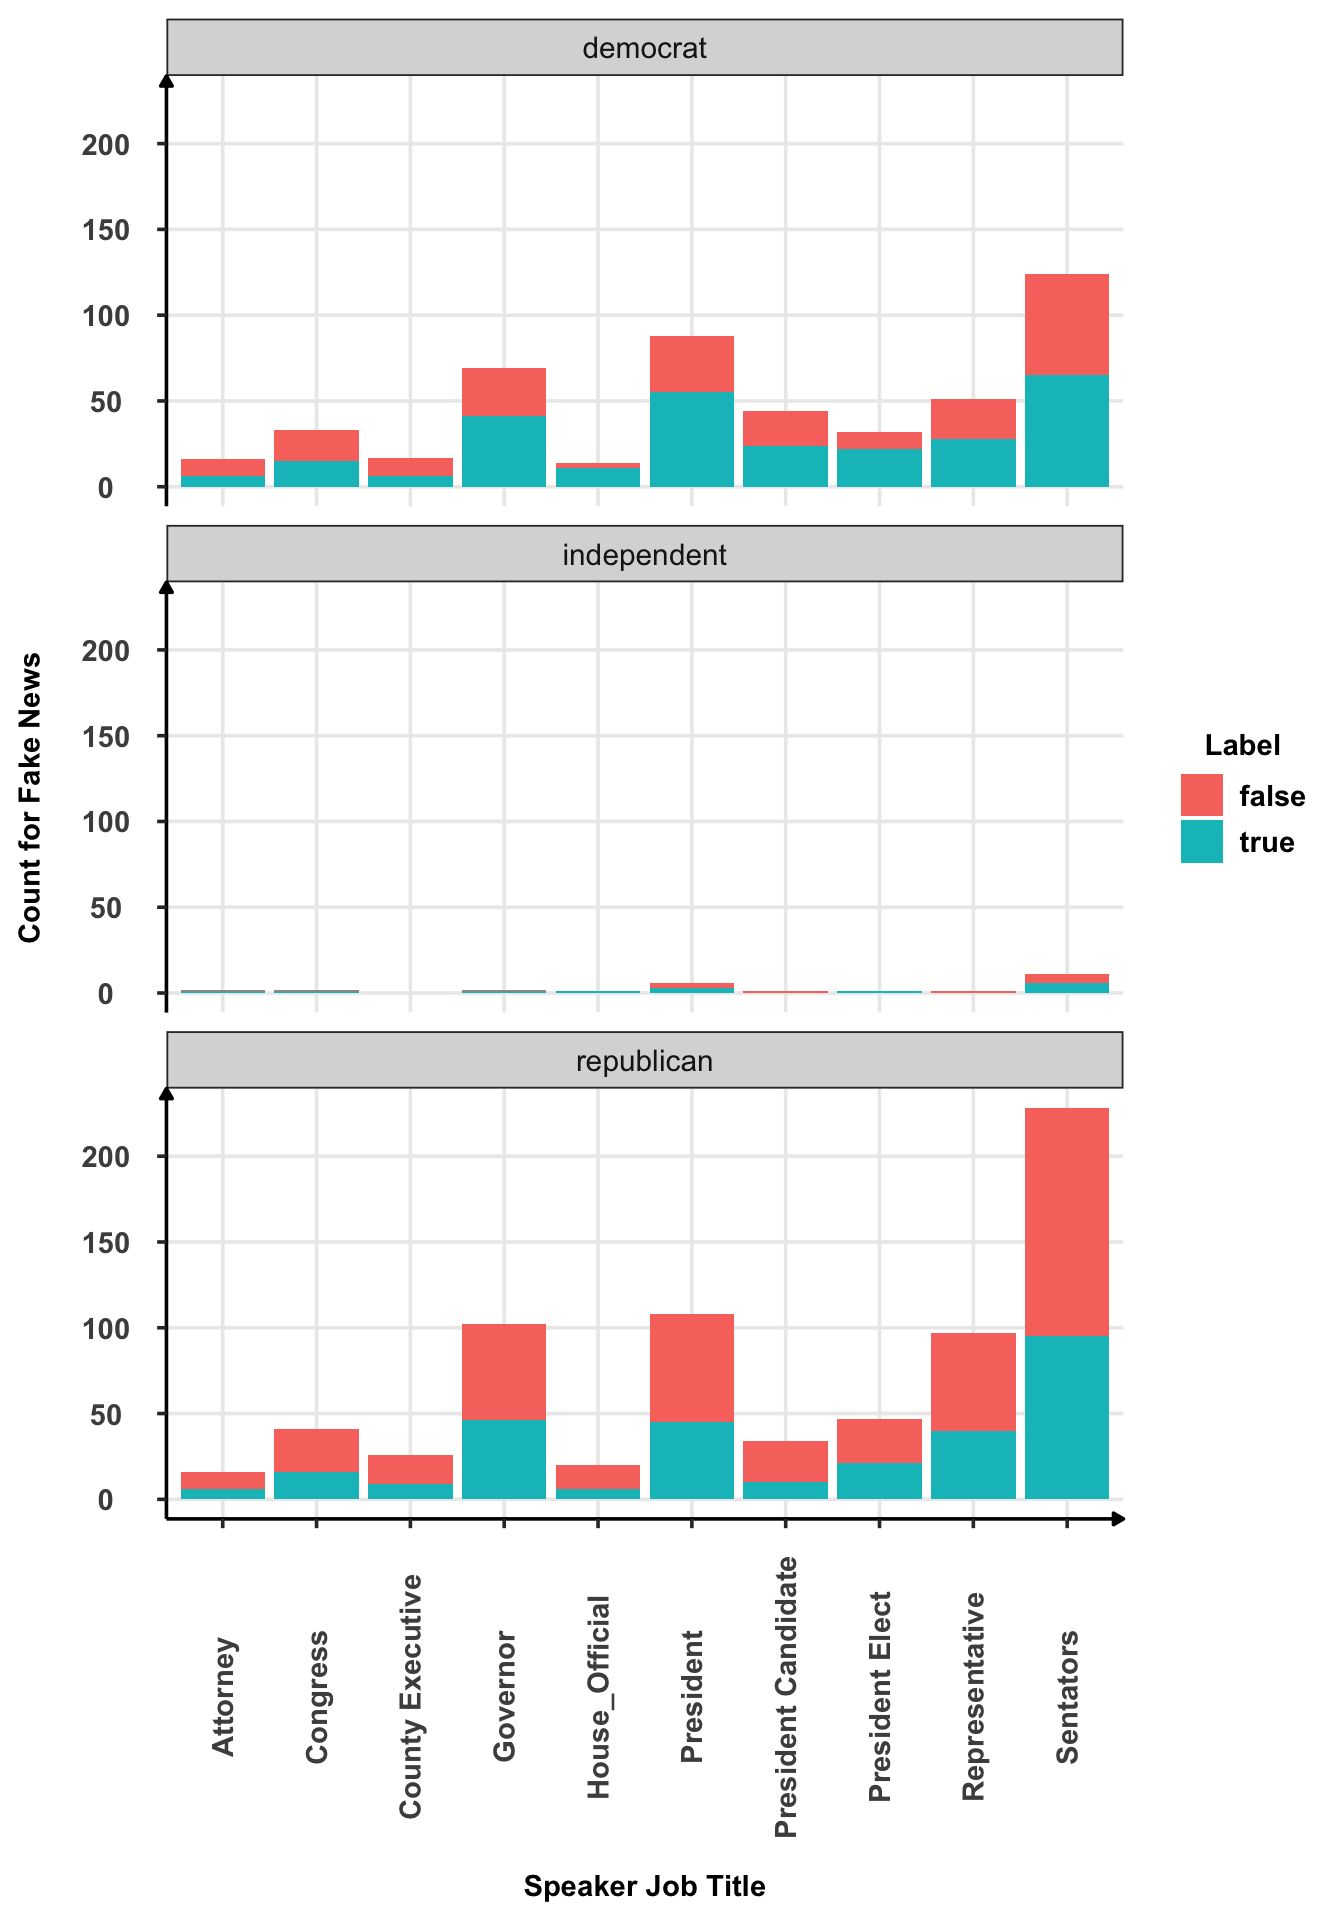
Observation from Graph 1.2
- The proportion of true news is higher than the proportion of false news for the Democrat and Independent parties, with the opposite case for the Republican party. This tells us that the Democrat and Independent parties are a little bit more reliable in delivery of truthful news.
- There is false news present for most speakers in every party, albeit at different proportions.
Question 2: What are the most selected topic/Subject picked by each Speaker which has the highest tendency of Spreading Fake News"
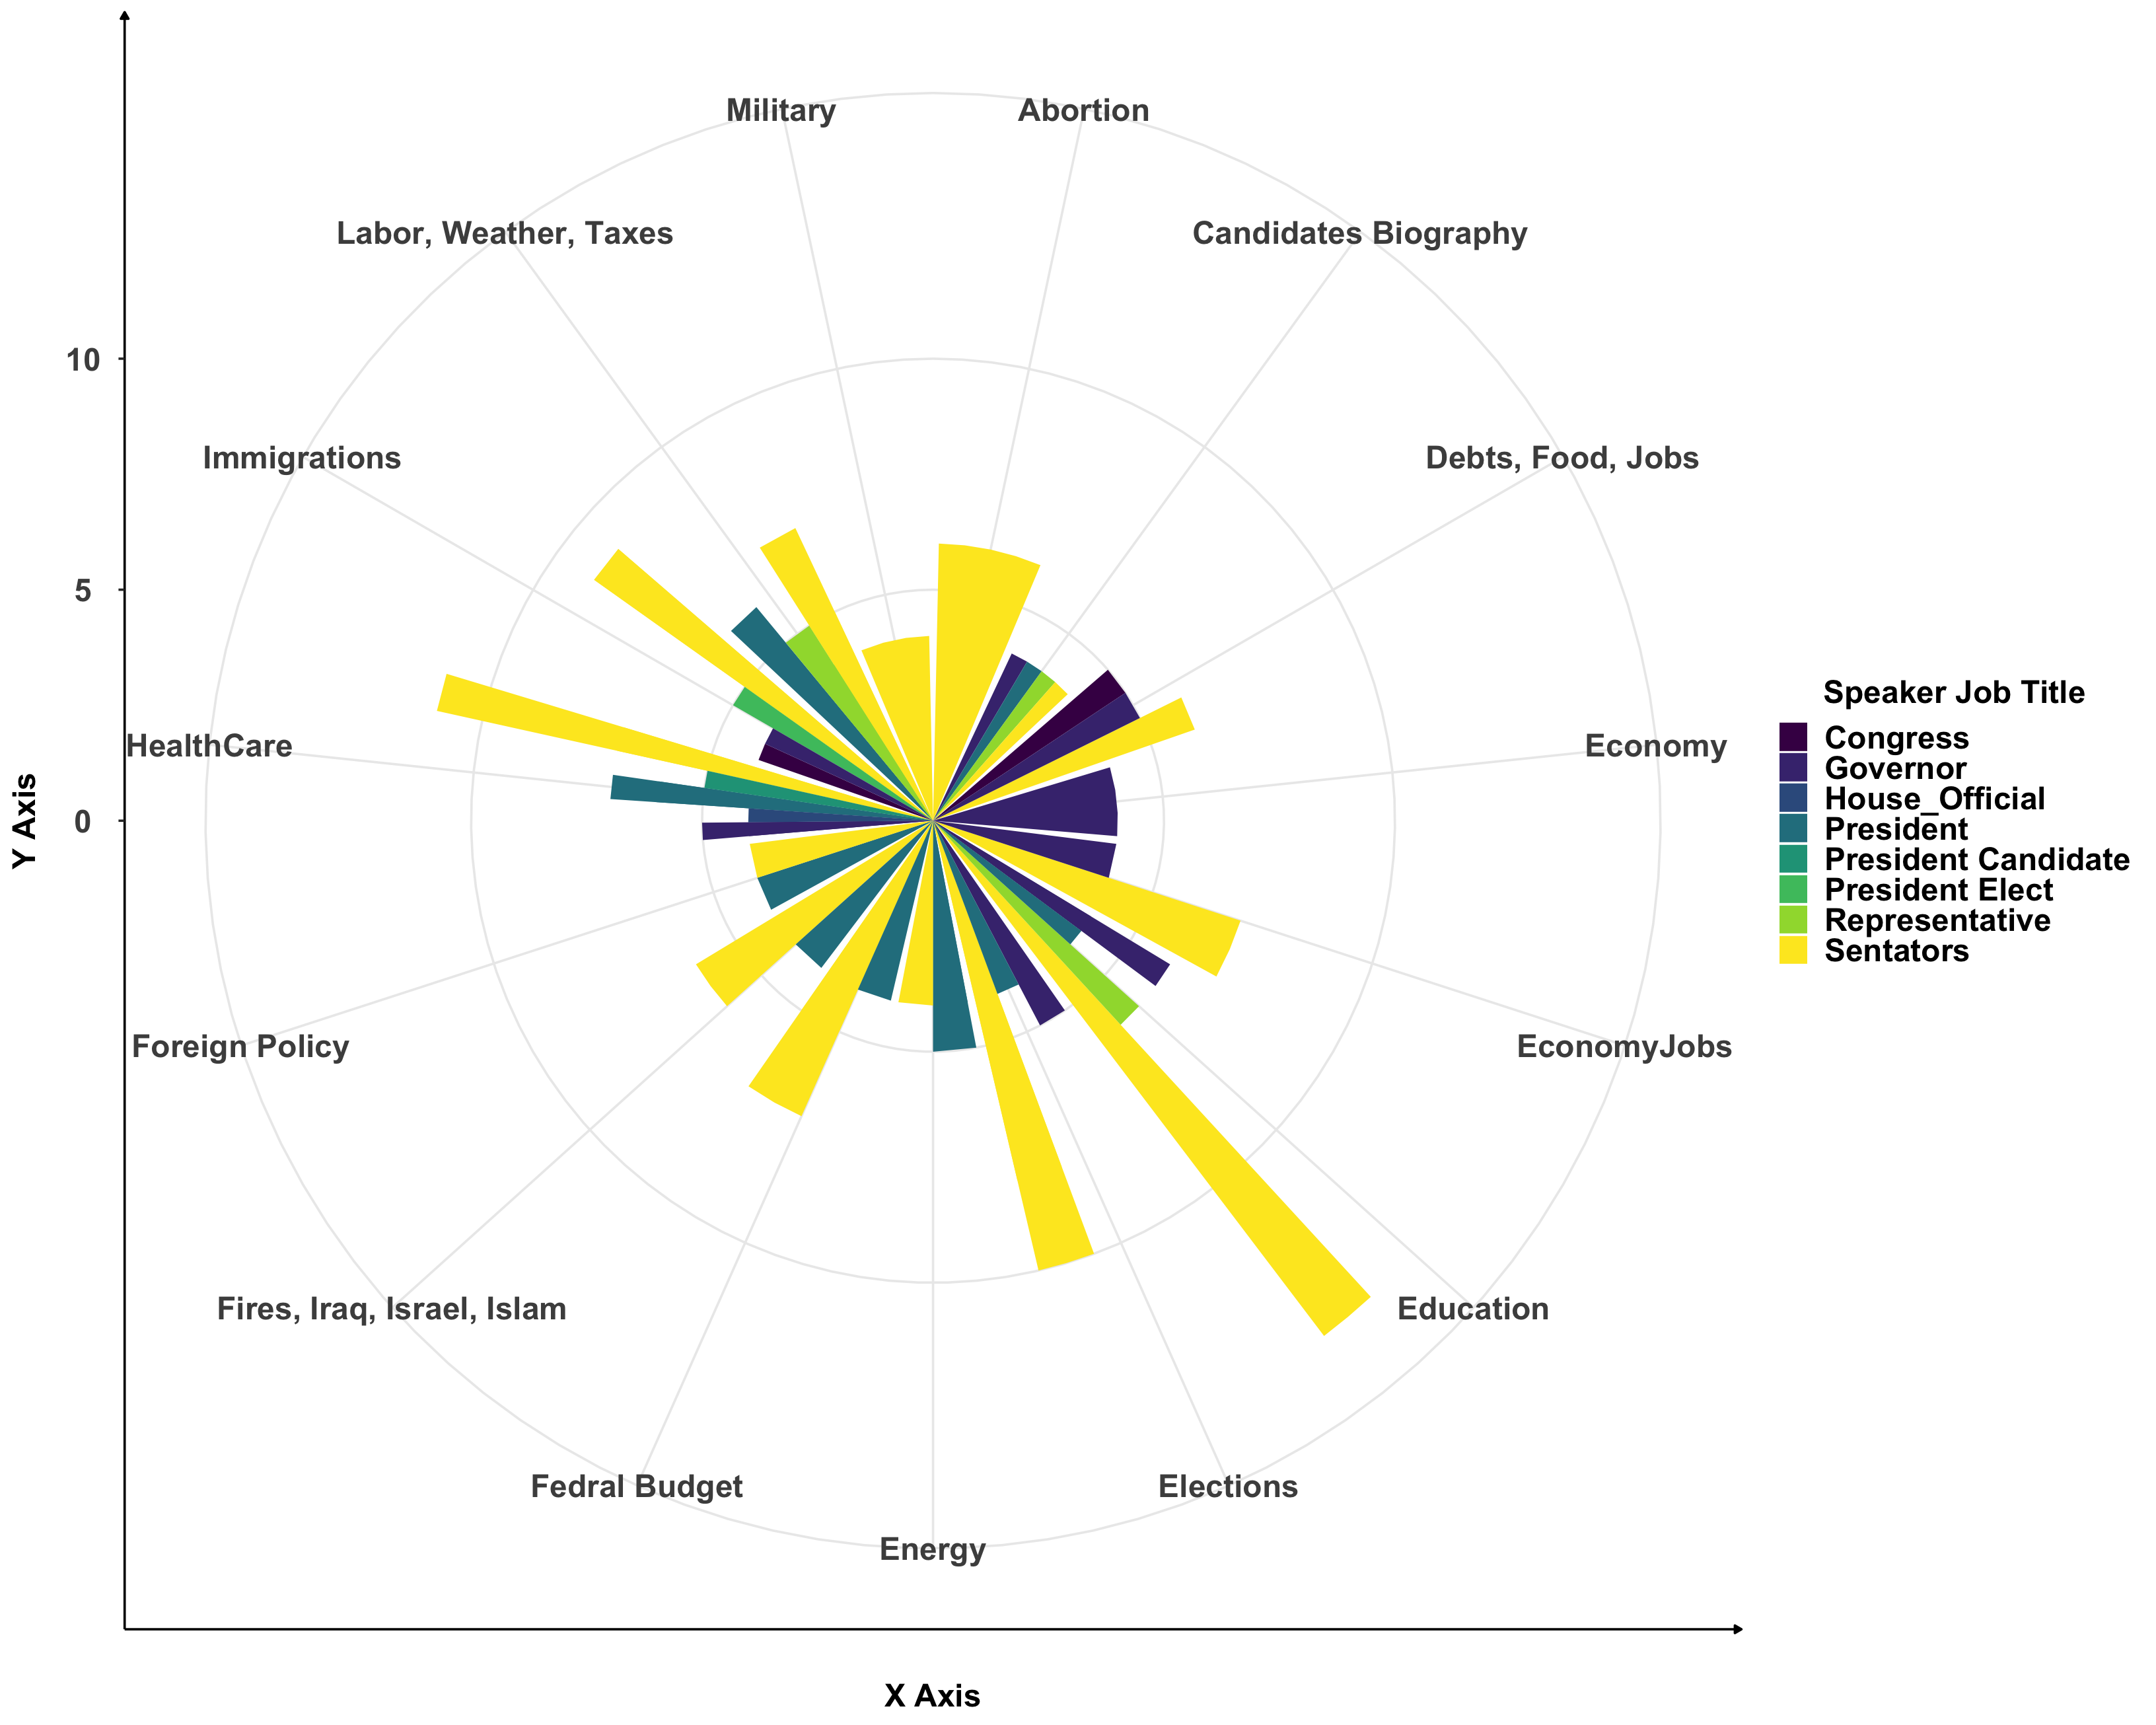
Observation from Graph
Senators have spread the most Fake News with respect to every topic present in the graph
President Candidates have spread fake news only in Immigration
President didn’t report Fake News related to topics in Military, Abortion, Debts, Jobs, and Economy.
Only Senators and President had fake news related to topics in Fires, Iraq, Israel, Islam, Foreign Policy, Fedral Budge, and Energy.
Education has the highest count for fake news.
Question 3: Which states are spreading the most false news, also noting the number of different speakers involved in spreading Fake News?
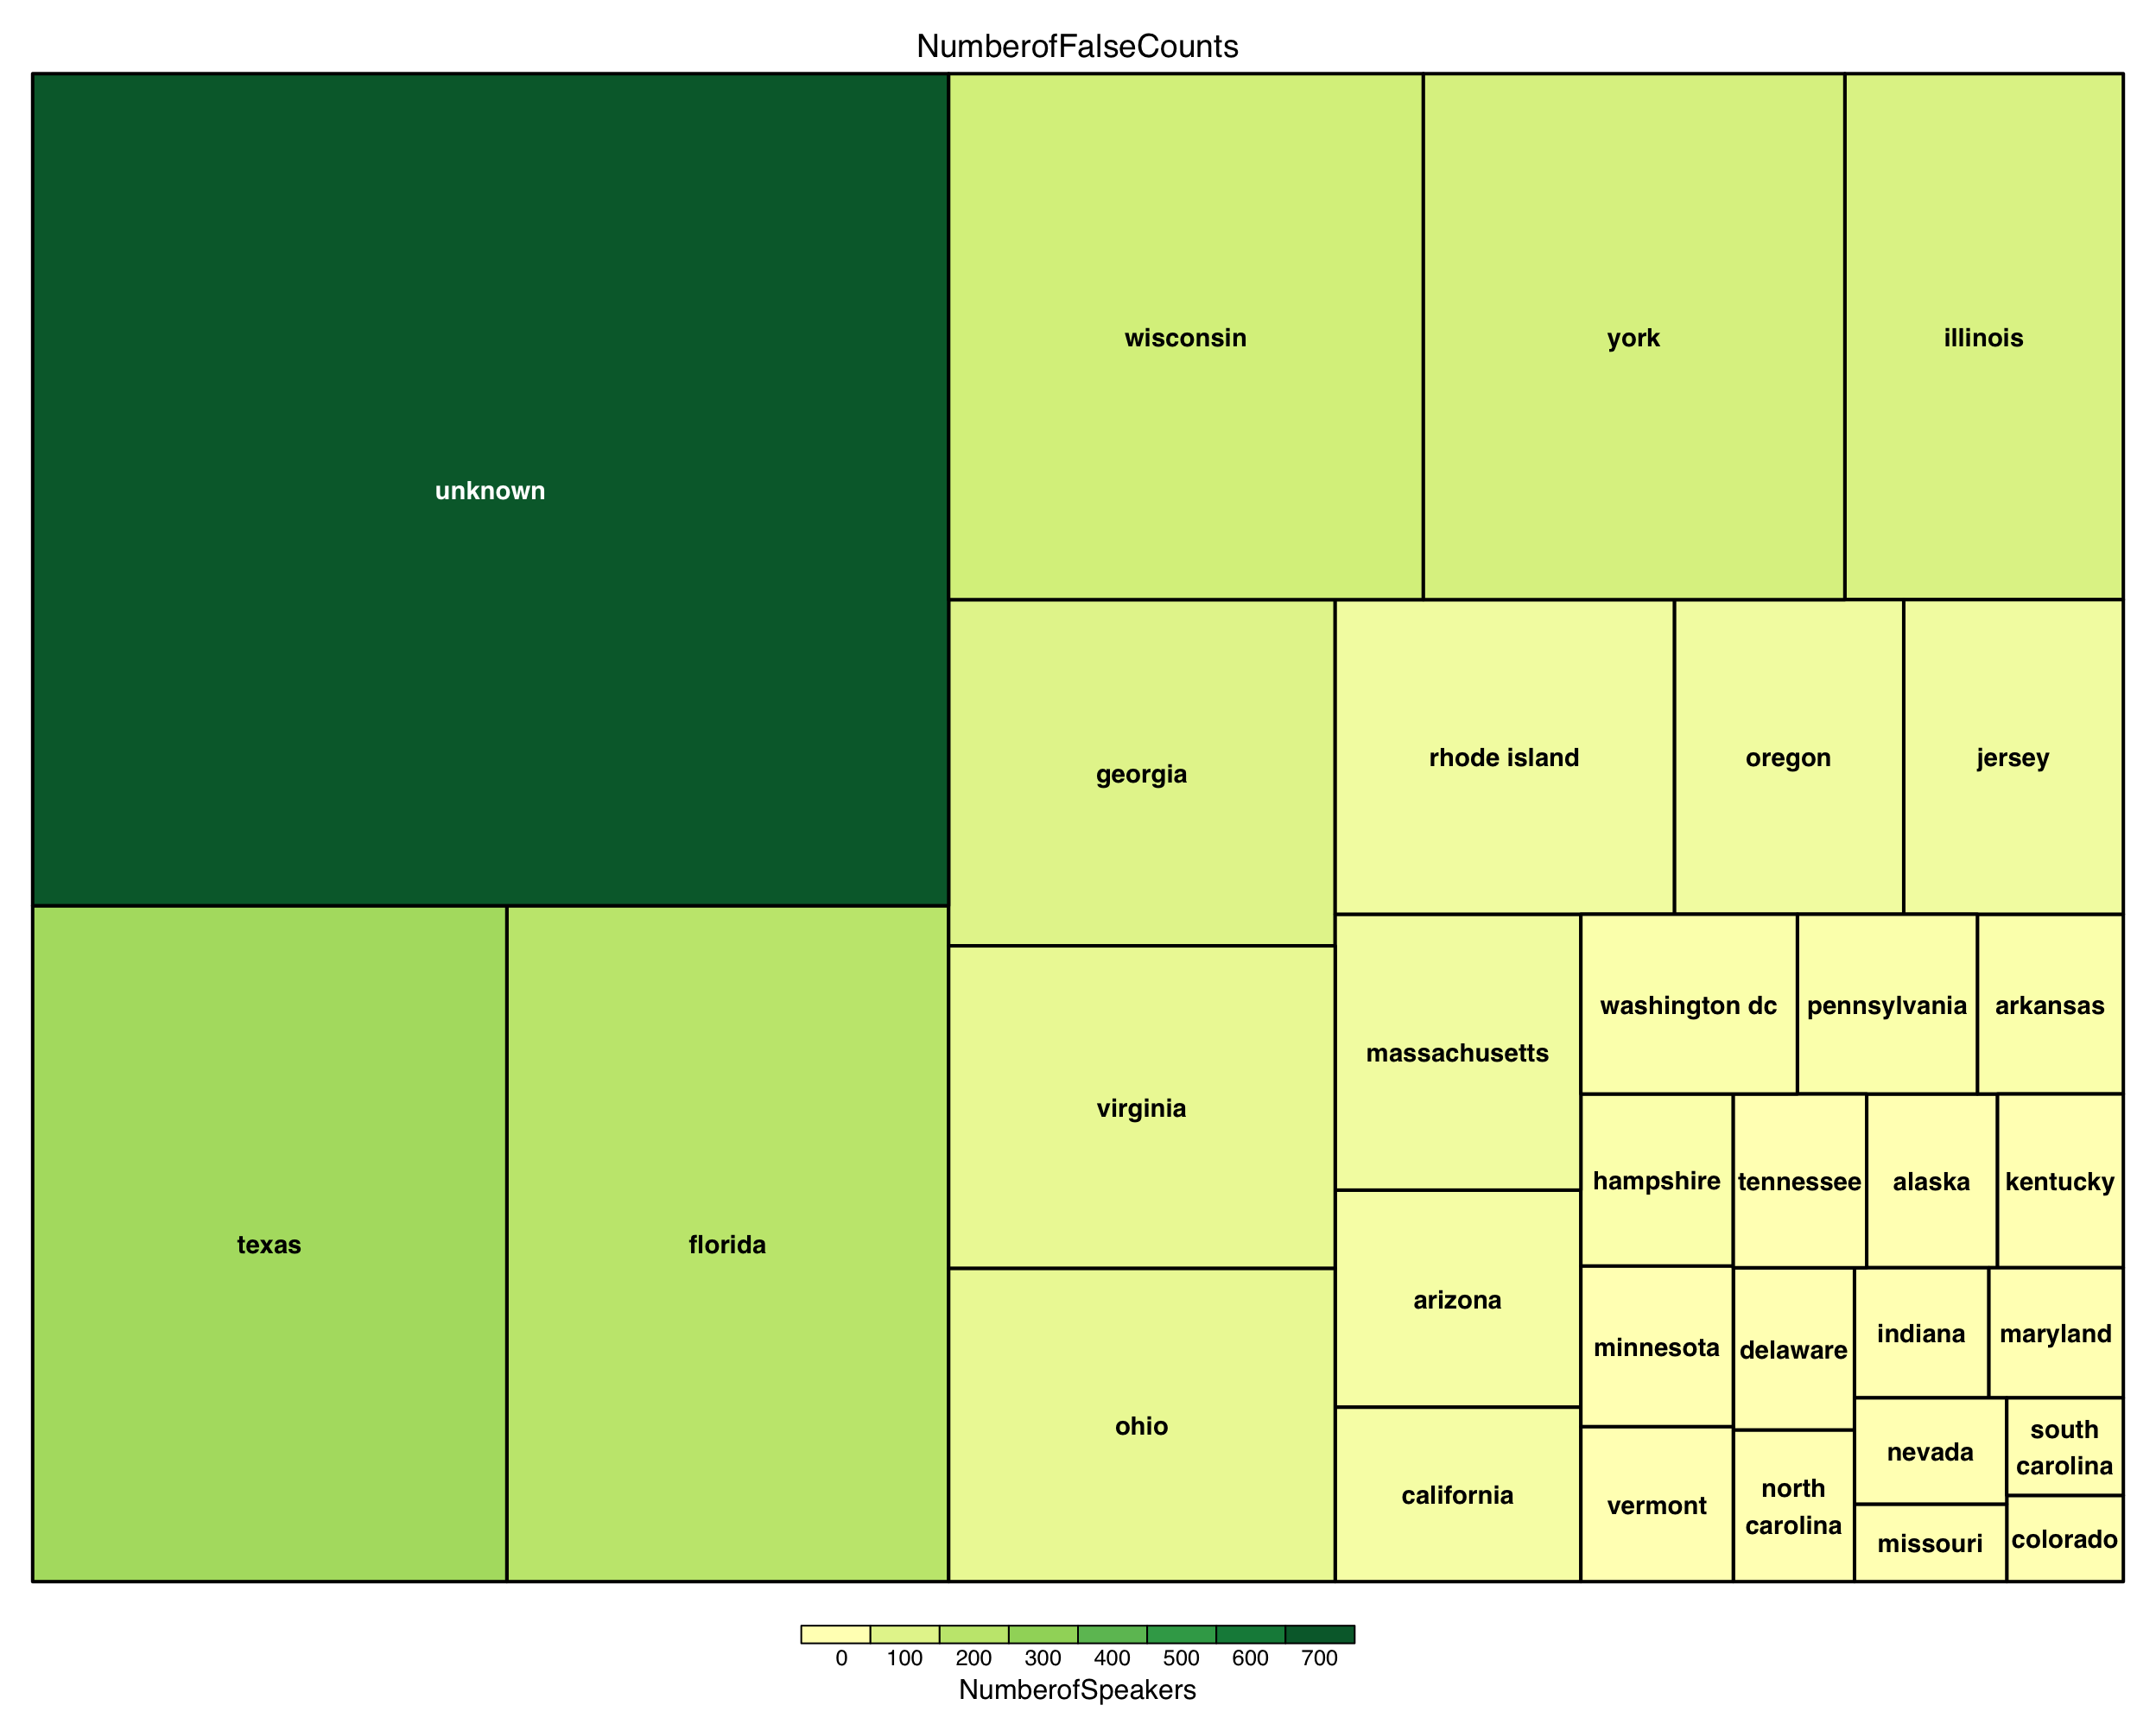
Observation from the Graphs
Above Graph gives a clear idea for the count of Fake News in each State. The larger the rectangle, the higher the number of Fake News was spread within the associated state. The color is mapped with the different number of speakers who spread fake news in the given state.
There were lot of states in the dataset which were labelled Unknown while pre-processing, which apparently are also spreading Fake News in high proportions
Texas is most widely known state to spread Fake News with about 400+ different Speakers involved in spreading Fake News
Count of Fake News spread is closely related with the different number of Speakers spreading the news. States with a smaller number of false counts have fewer number of speakers.
New York, Wisconsin and Florida have almost equal number of counts in spreading Fake News, which are comparatively high when compare to other states. Also, Wisconsin and New York share the same count for number of speakers but the Florida has highest number of different speakers among the three.
Question 4: Which method of communication has resulted in the most Fake News spread by state?
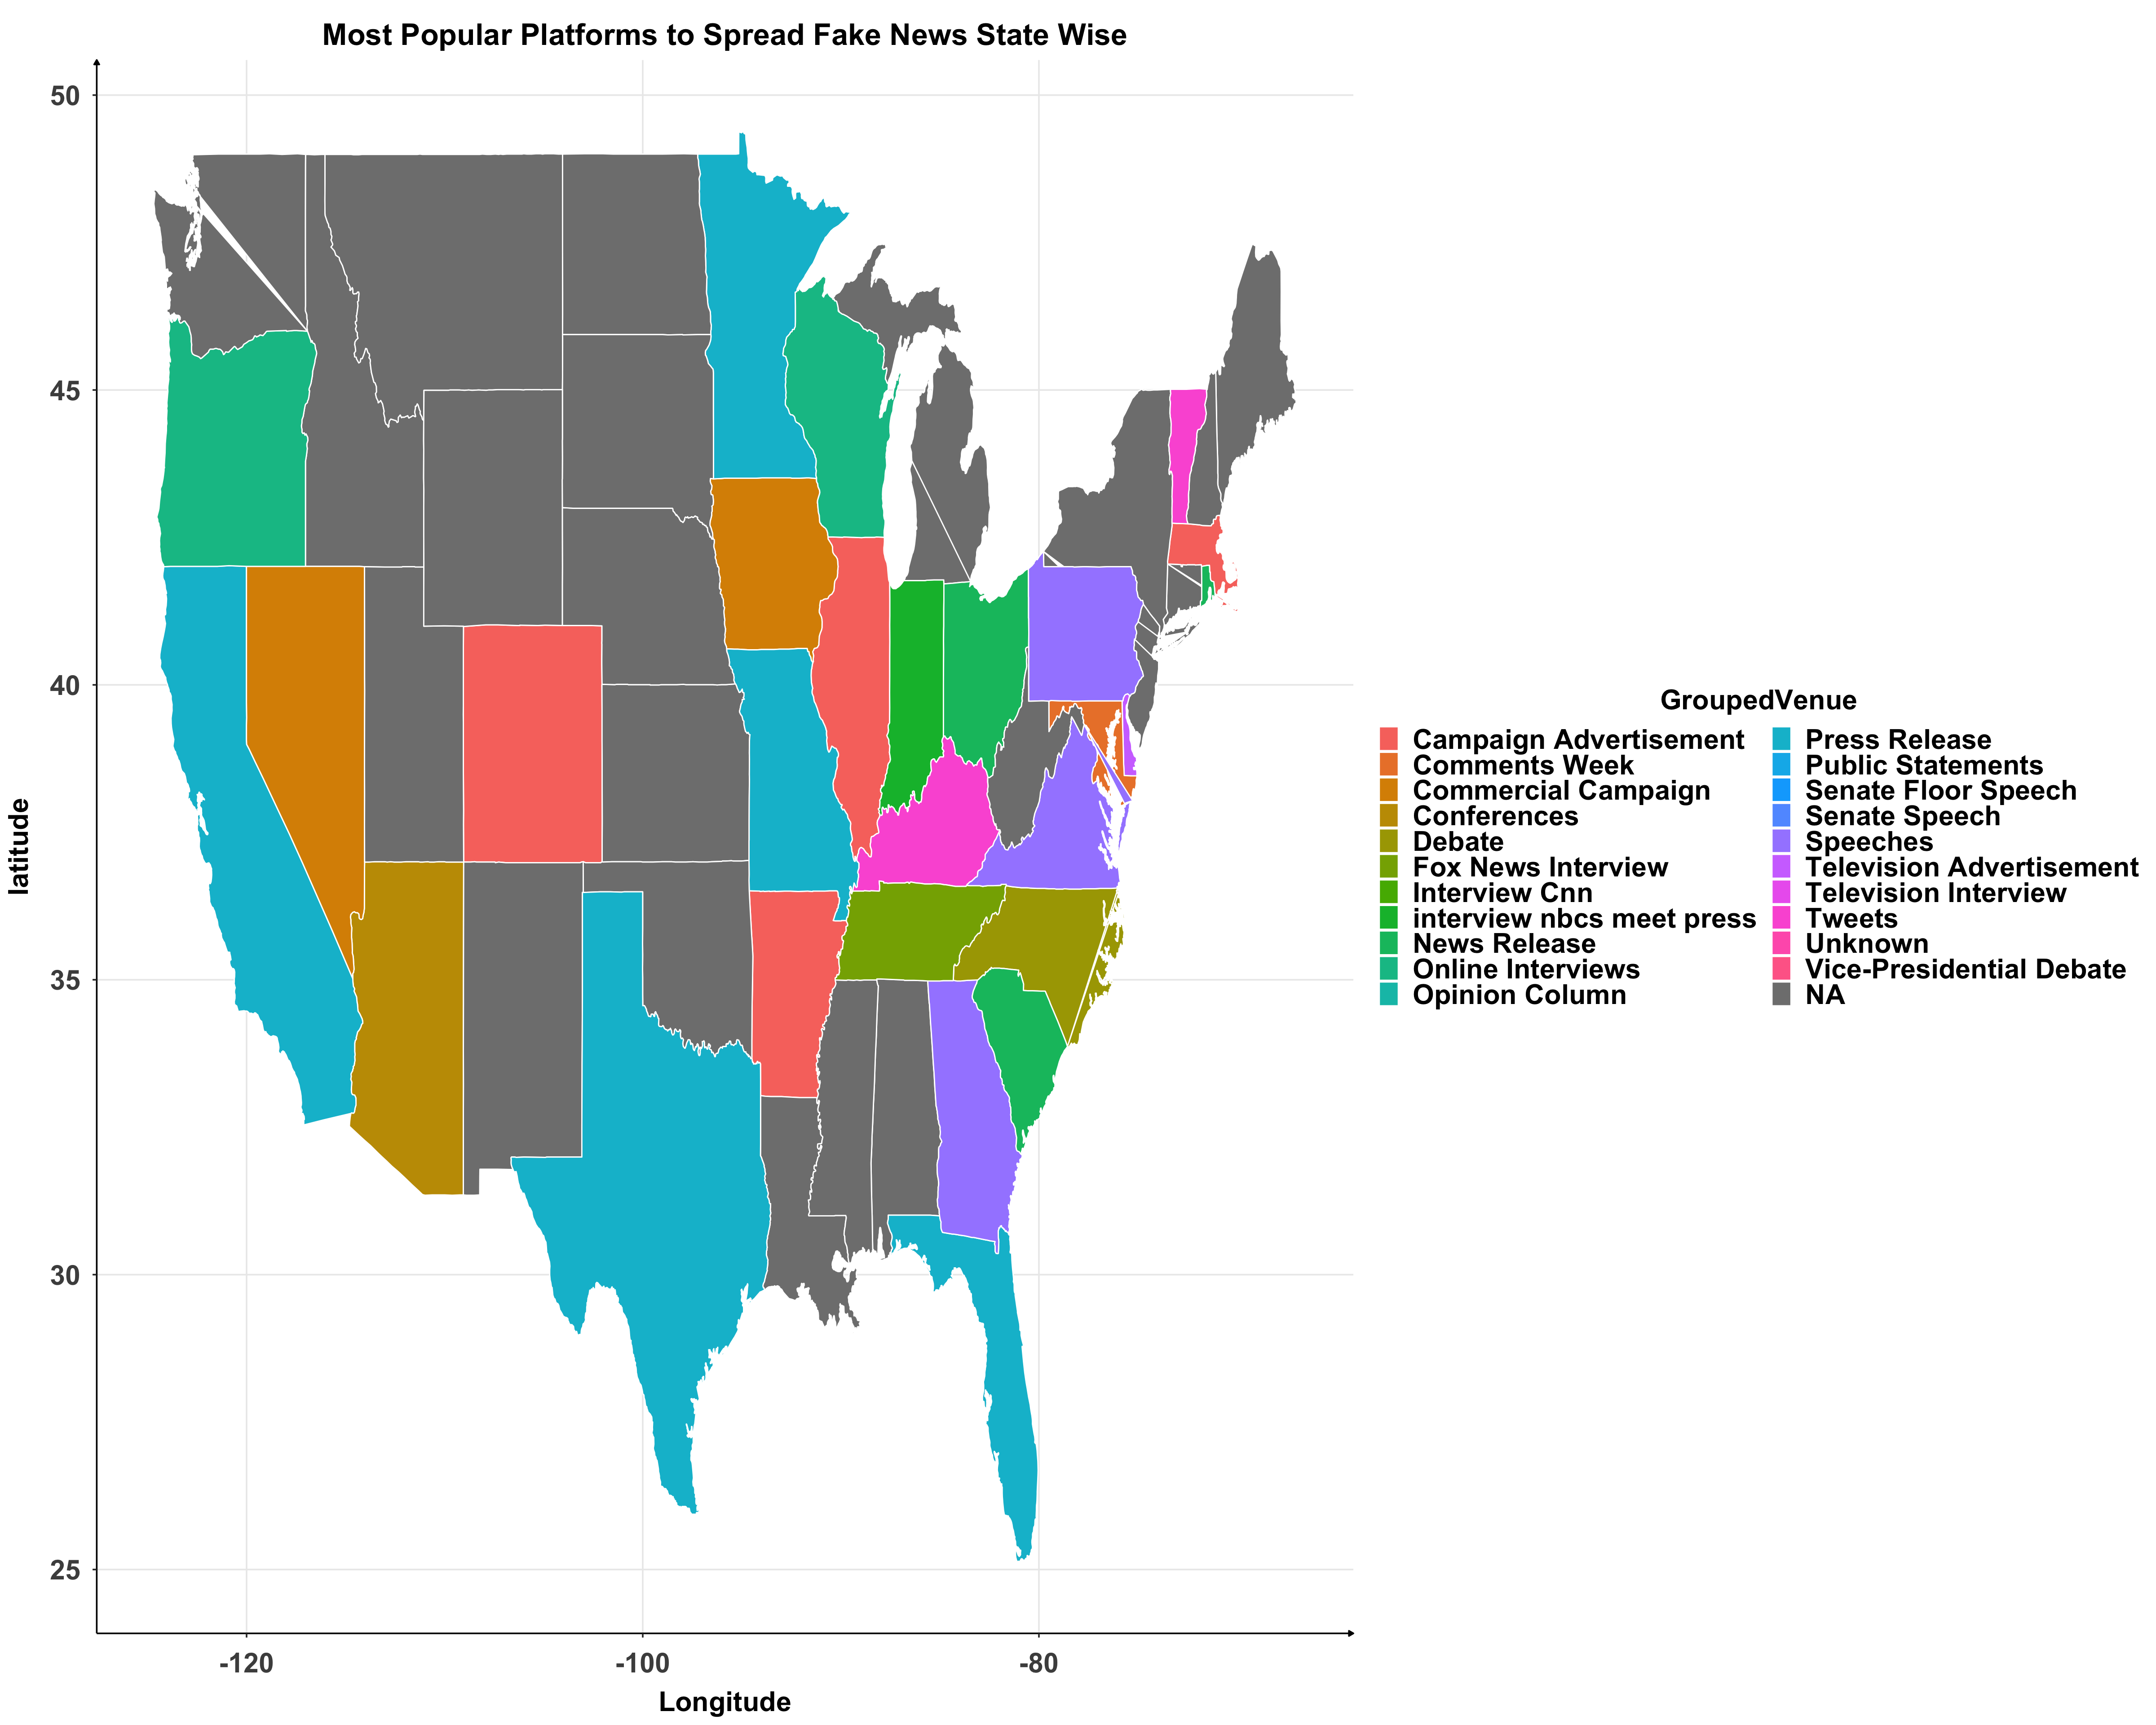
Observation from Graph
Below are a few venues/platforms which were used the most to spread fake news per State.
Florida, Texas, California, Indiana, Maryland, Missouri, and North Carolina mostly spread Fake News through Press Releases.
Georgia, Illinois, Pennsylvania, Virginia mostly spread Fake News through Speeches.
Many states used a variety of venues to spread fake news, rather than just one consistent venue. Hence the gray spots in the graph.
Our grouping of the Venues (such as Tweets/Tweet to Tweet) might not be completely accurate since we used group_str to do the concatenation with the distance of similarity as 3 between words. This parameter can be manipulated for better efficiency.
Question 5: Correlations, Clusters & Outliers observed for different Venues/Platforms in spreading Fake News for each State.
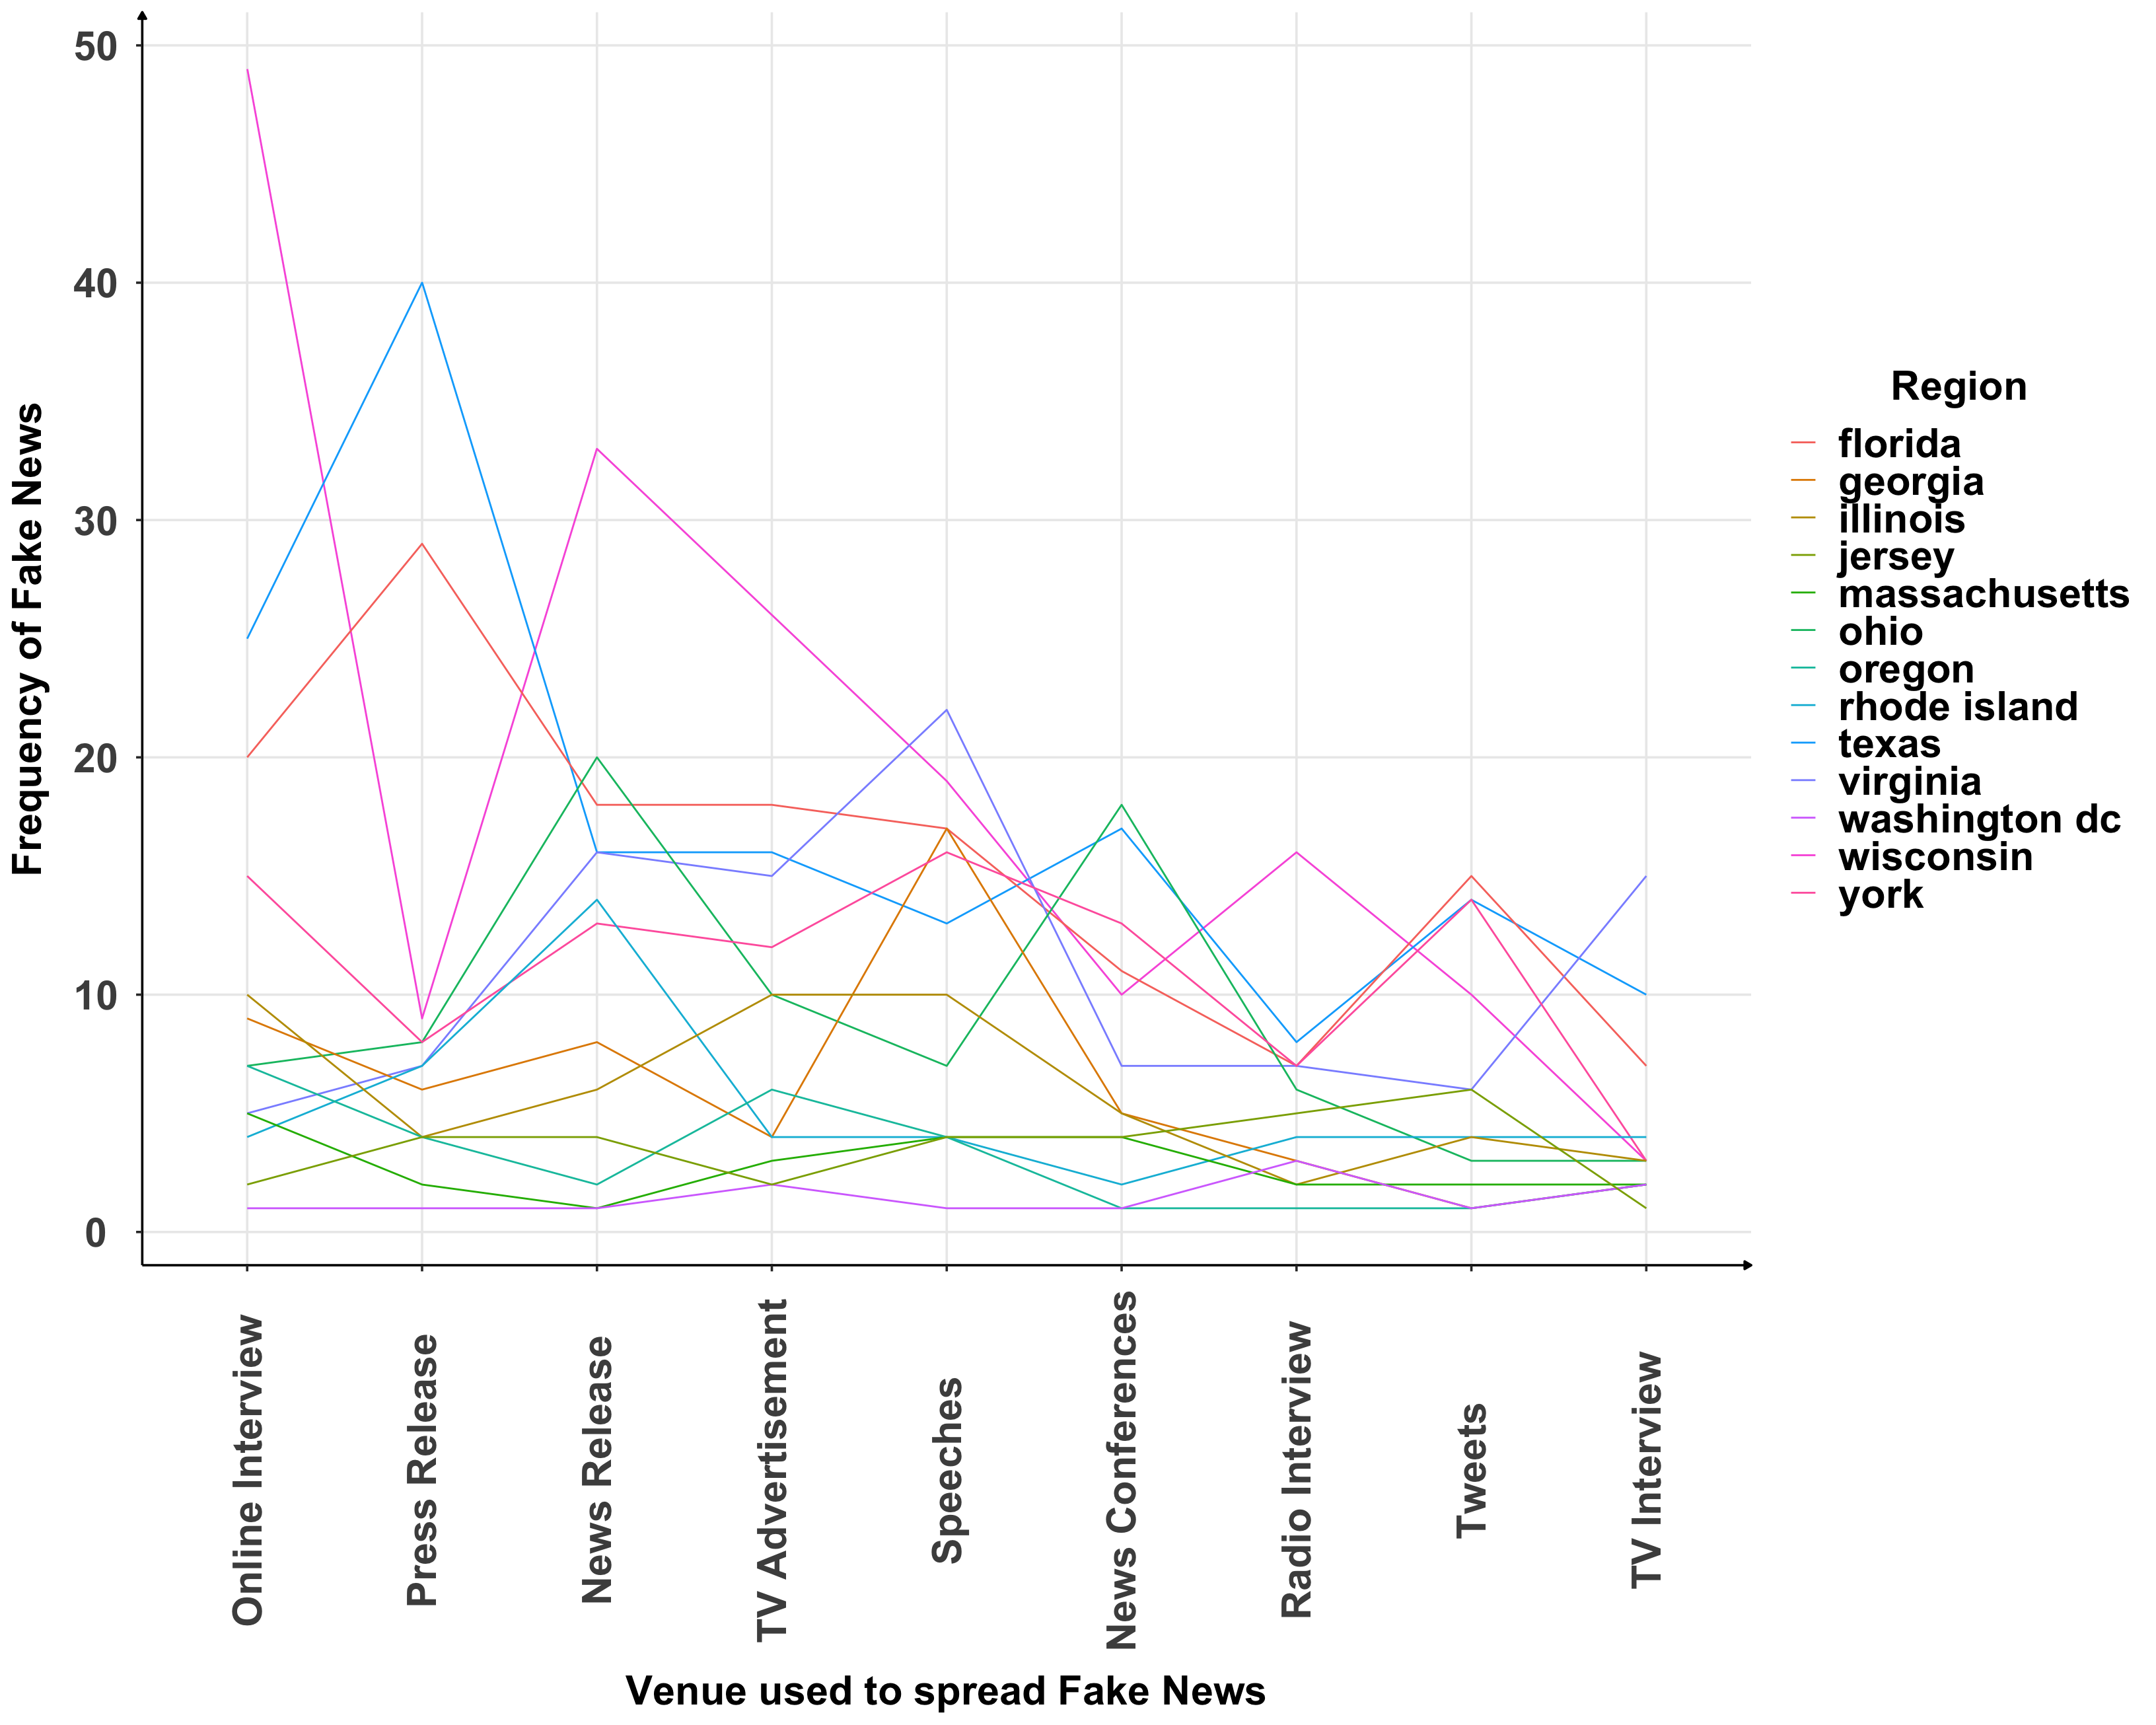
Observation from the Graphs
The count of Fake News spread for the venue OnlineInterview was less than 10 for all regions except Wisconsin, Texas and Florida.
Most of the States, which have used Press Release for spreading Fake News, have also used News Release. We observed a positive correlation between these two venues for most States
Similarly, we noticed a negative correlation between News Release and TV Advertisement. The states which have used News Release have a reduced count for TV Advertisements
We noticed a wide range of differences in count between New York & Jersey for each venue.
Surprisingly, Twitter had relatively low frequencies for each State despite being the most popular social media platform.
Question 6: Count of Words in a Statement in relation with its Label
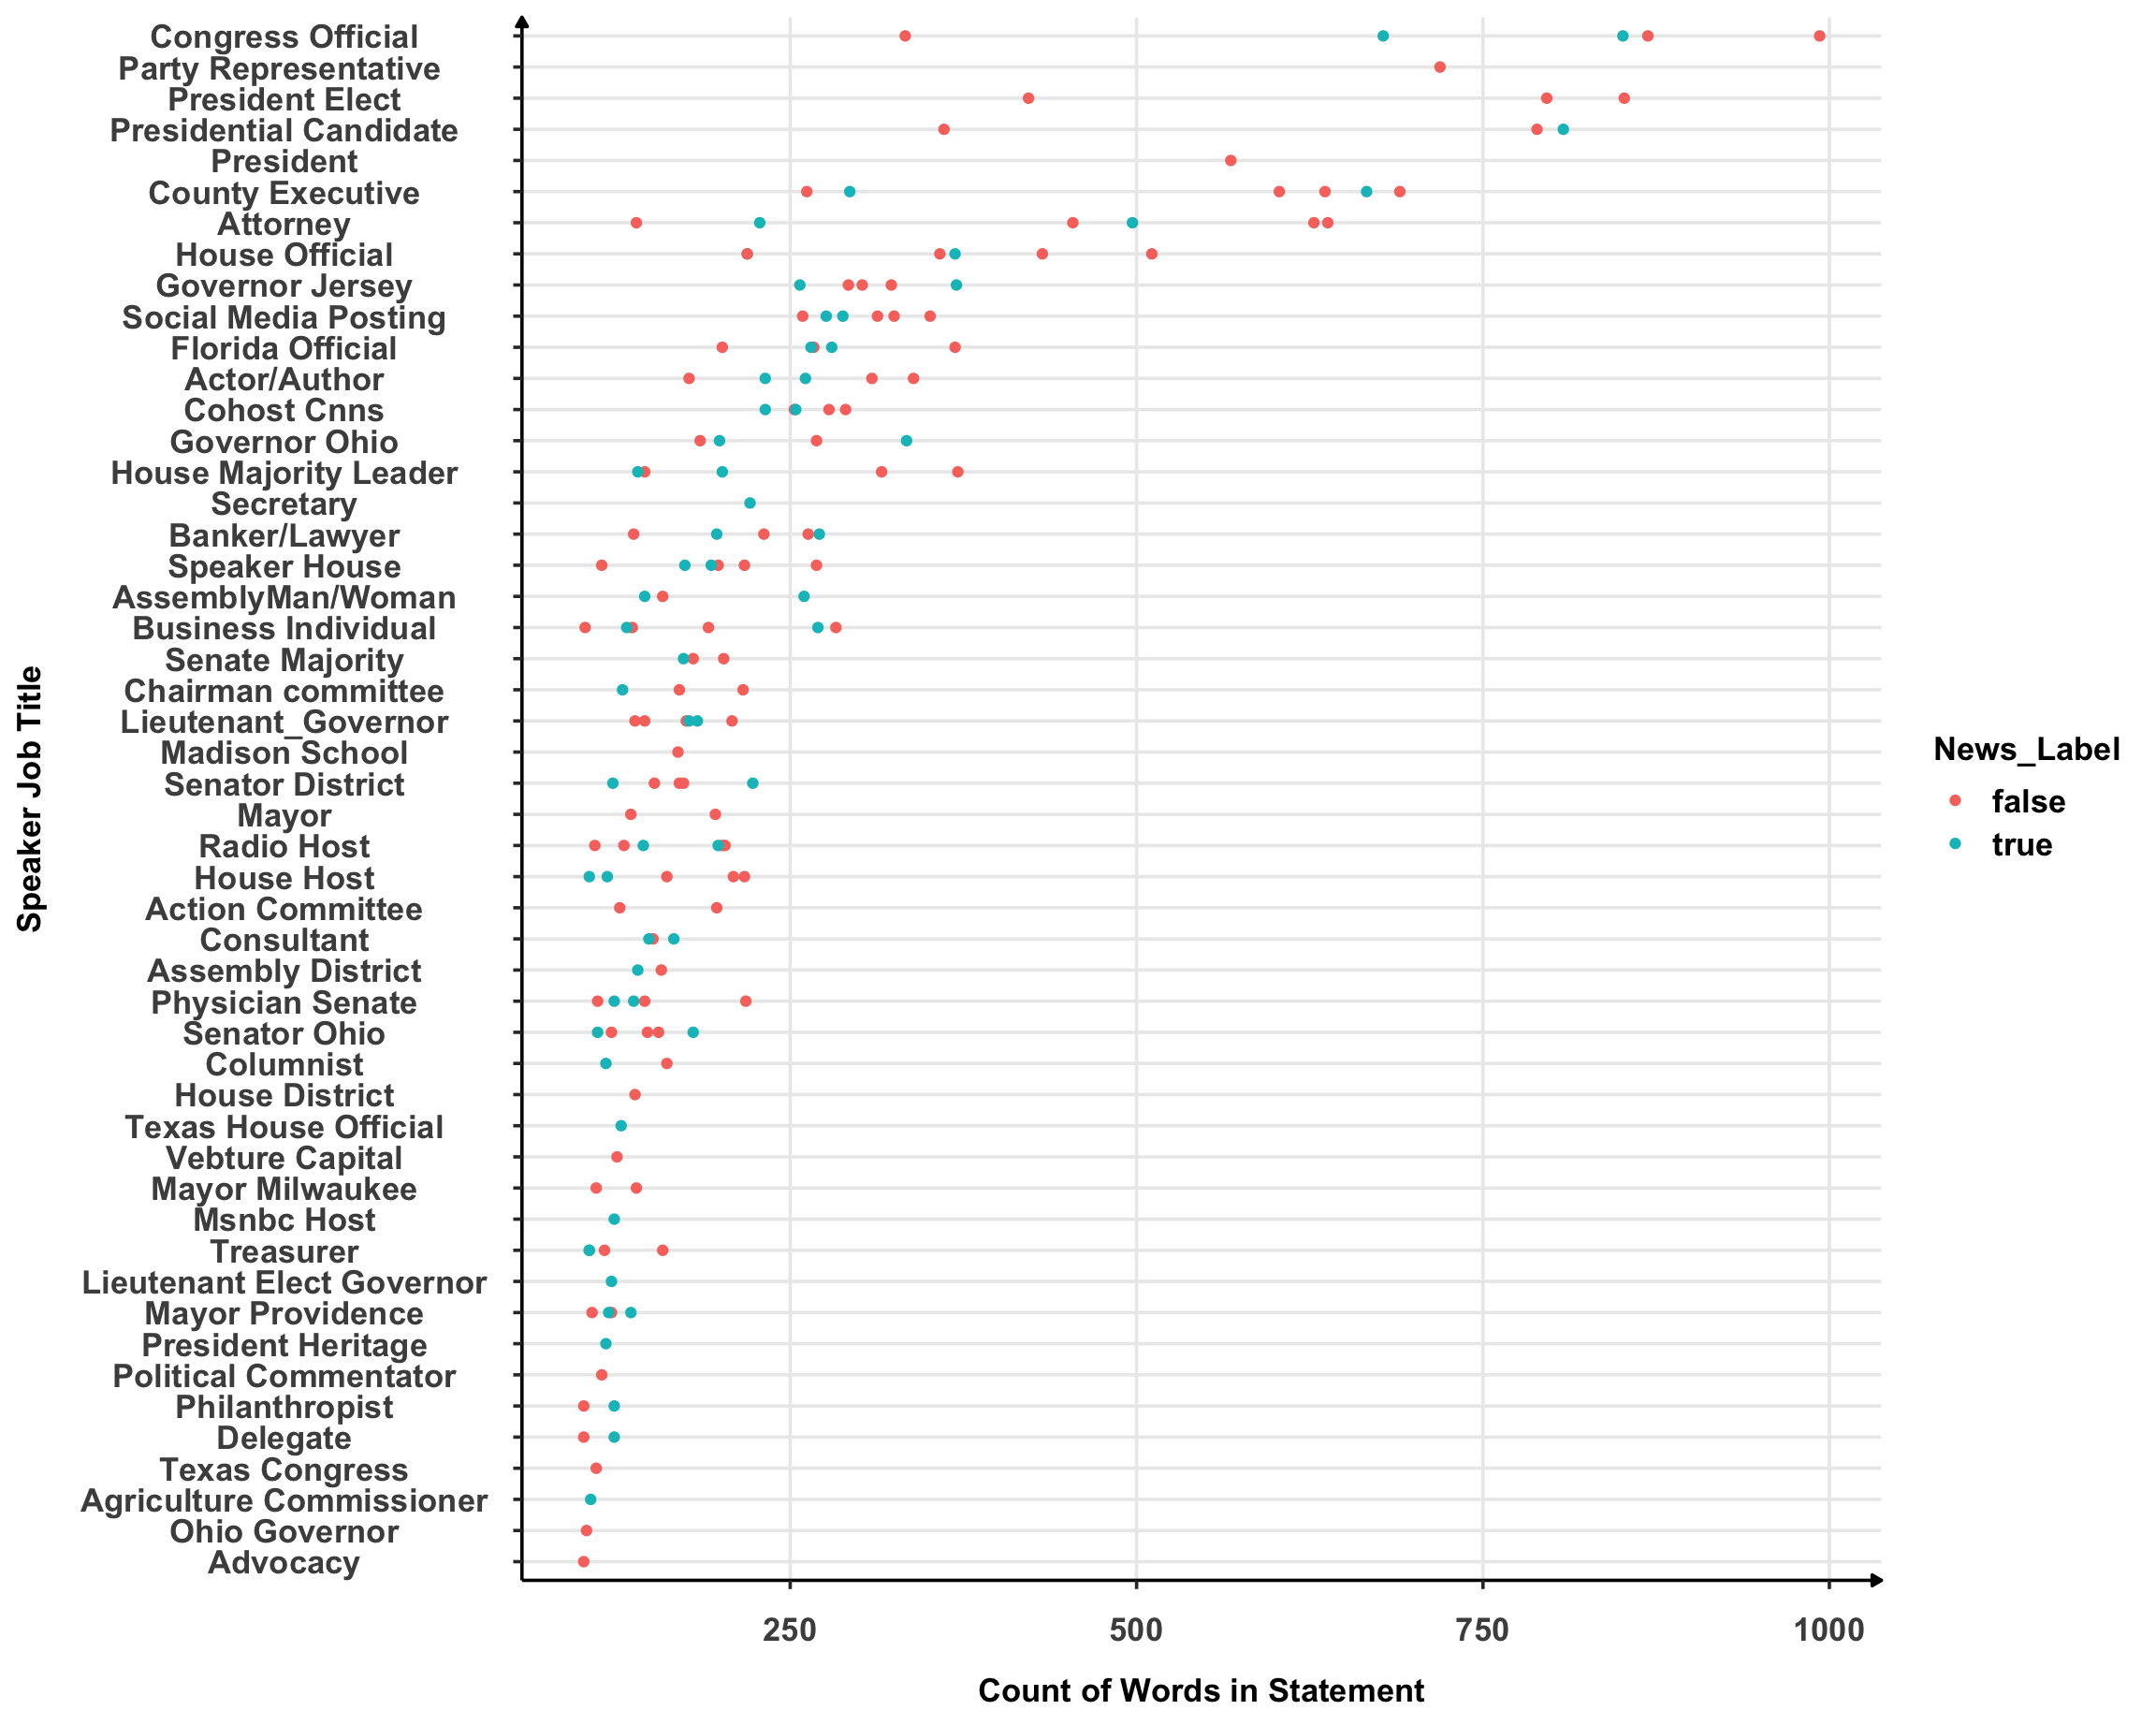
Observation from the Graphs
Note: the statements shown on the graph are between 100 and 1000 words.
For most speakers, there are more true than false statements given that they have less than 300 words.
For statements with over 300 words, there is a higher count of true statements compared to false statements.
Question 7: What are the proportions of fake news for each state?
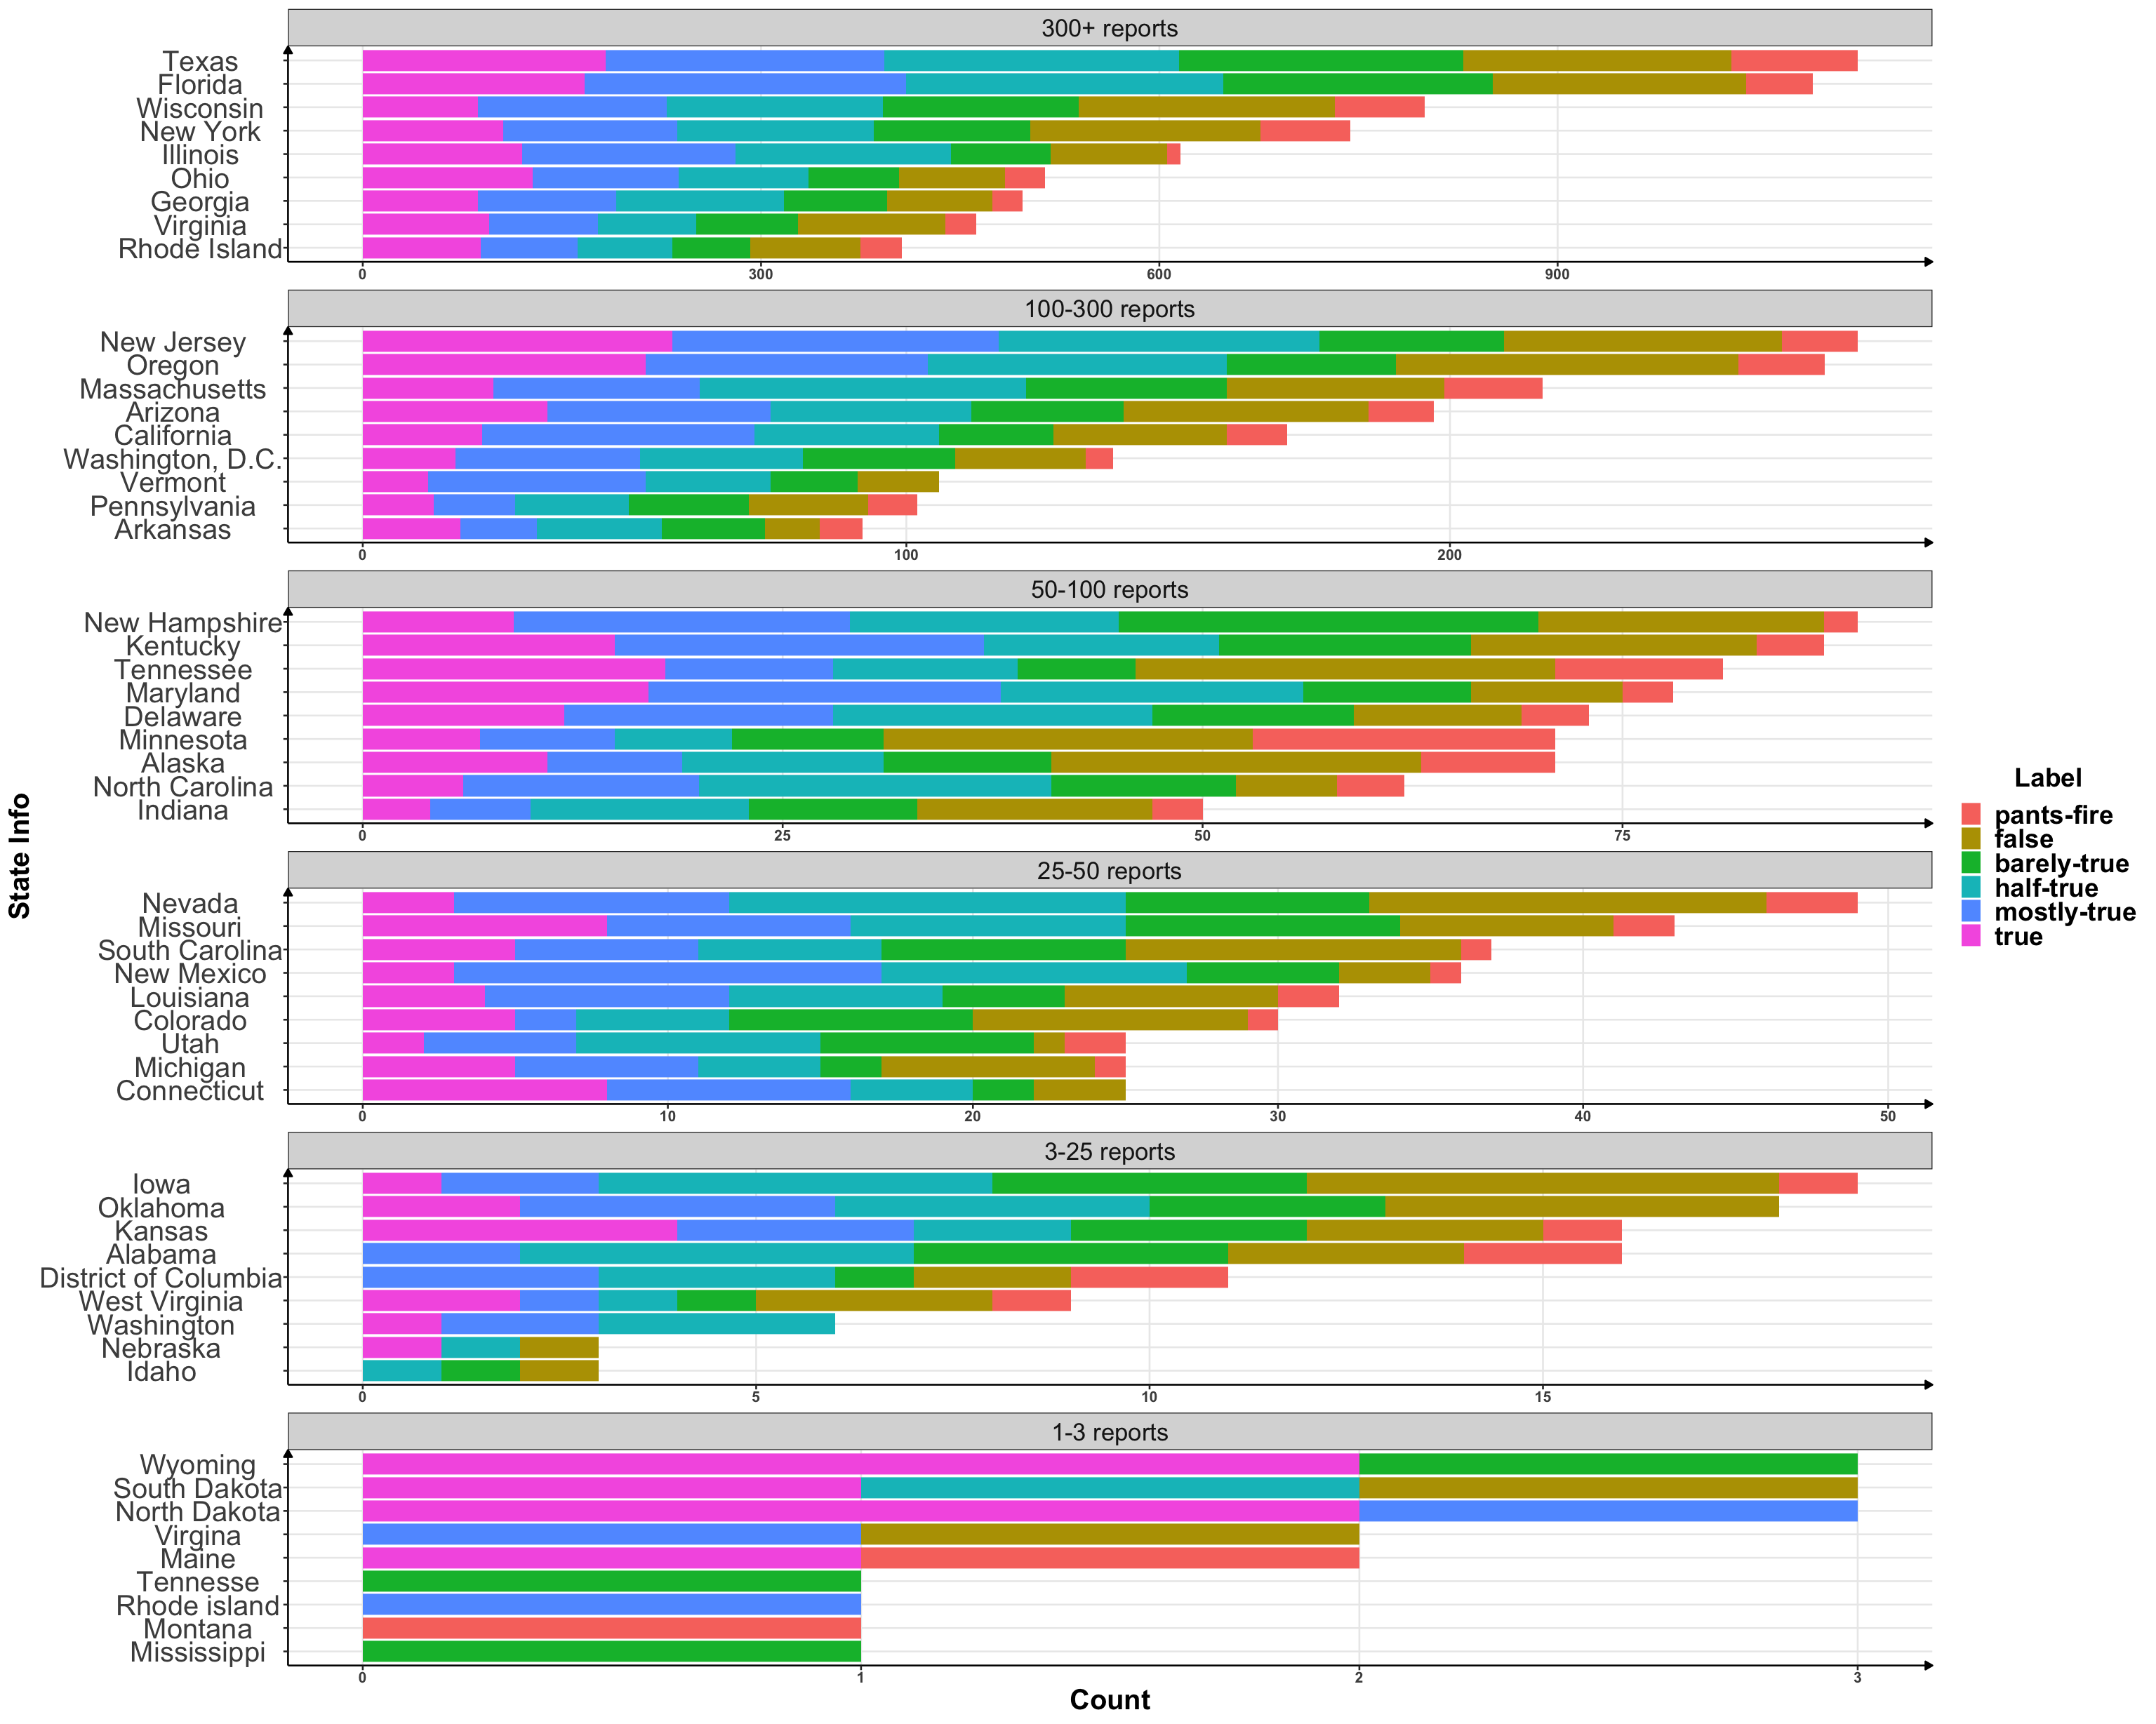
Observation from the Graphs
All states generally report a variety of news ranging throughout the entire truth spectrum (from true to false).
The majority of news reports have some level of truth in them, with the exception of Maine and Minnesota.
All states follow roughly the same distribution of fake news (of course, with the exception of states with very few reports).
Texas reported the most news while Tennessee, Montana, Rhode Island, and Mississippi have the fewest news reports out of all states.
Out of all states with over 100 reports, Vermont was the only state that did not make any pants-on-fire reports (in other words, Vermont was the only state with over 100 reports that did not make any ridiculous claims).
Question 8: What are the states with maximum proportions of fake news and in what subject?
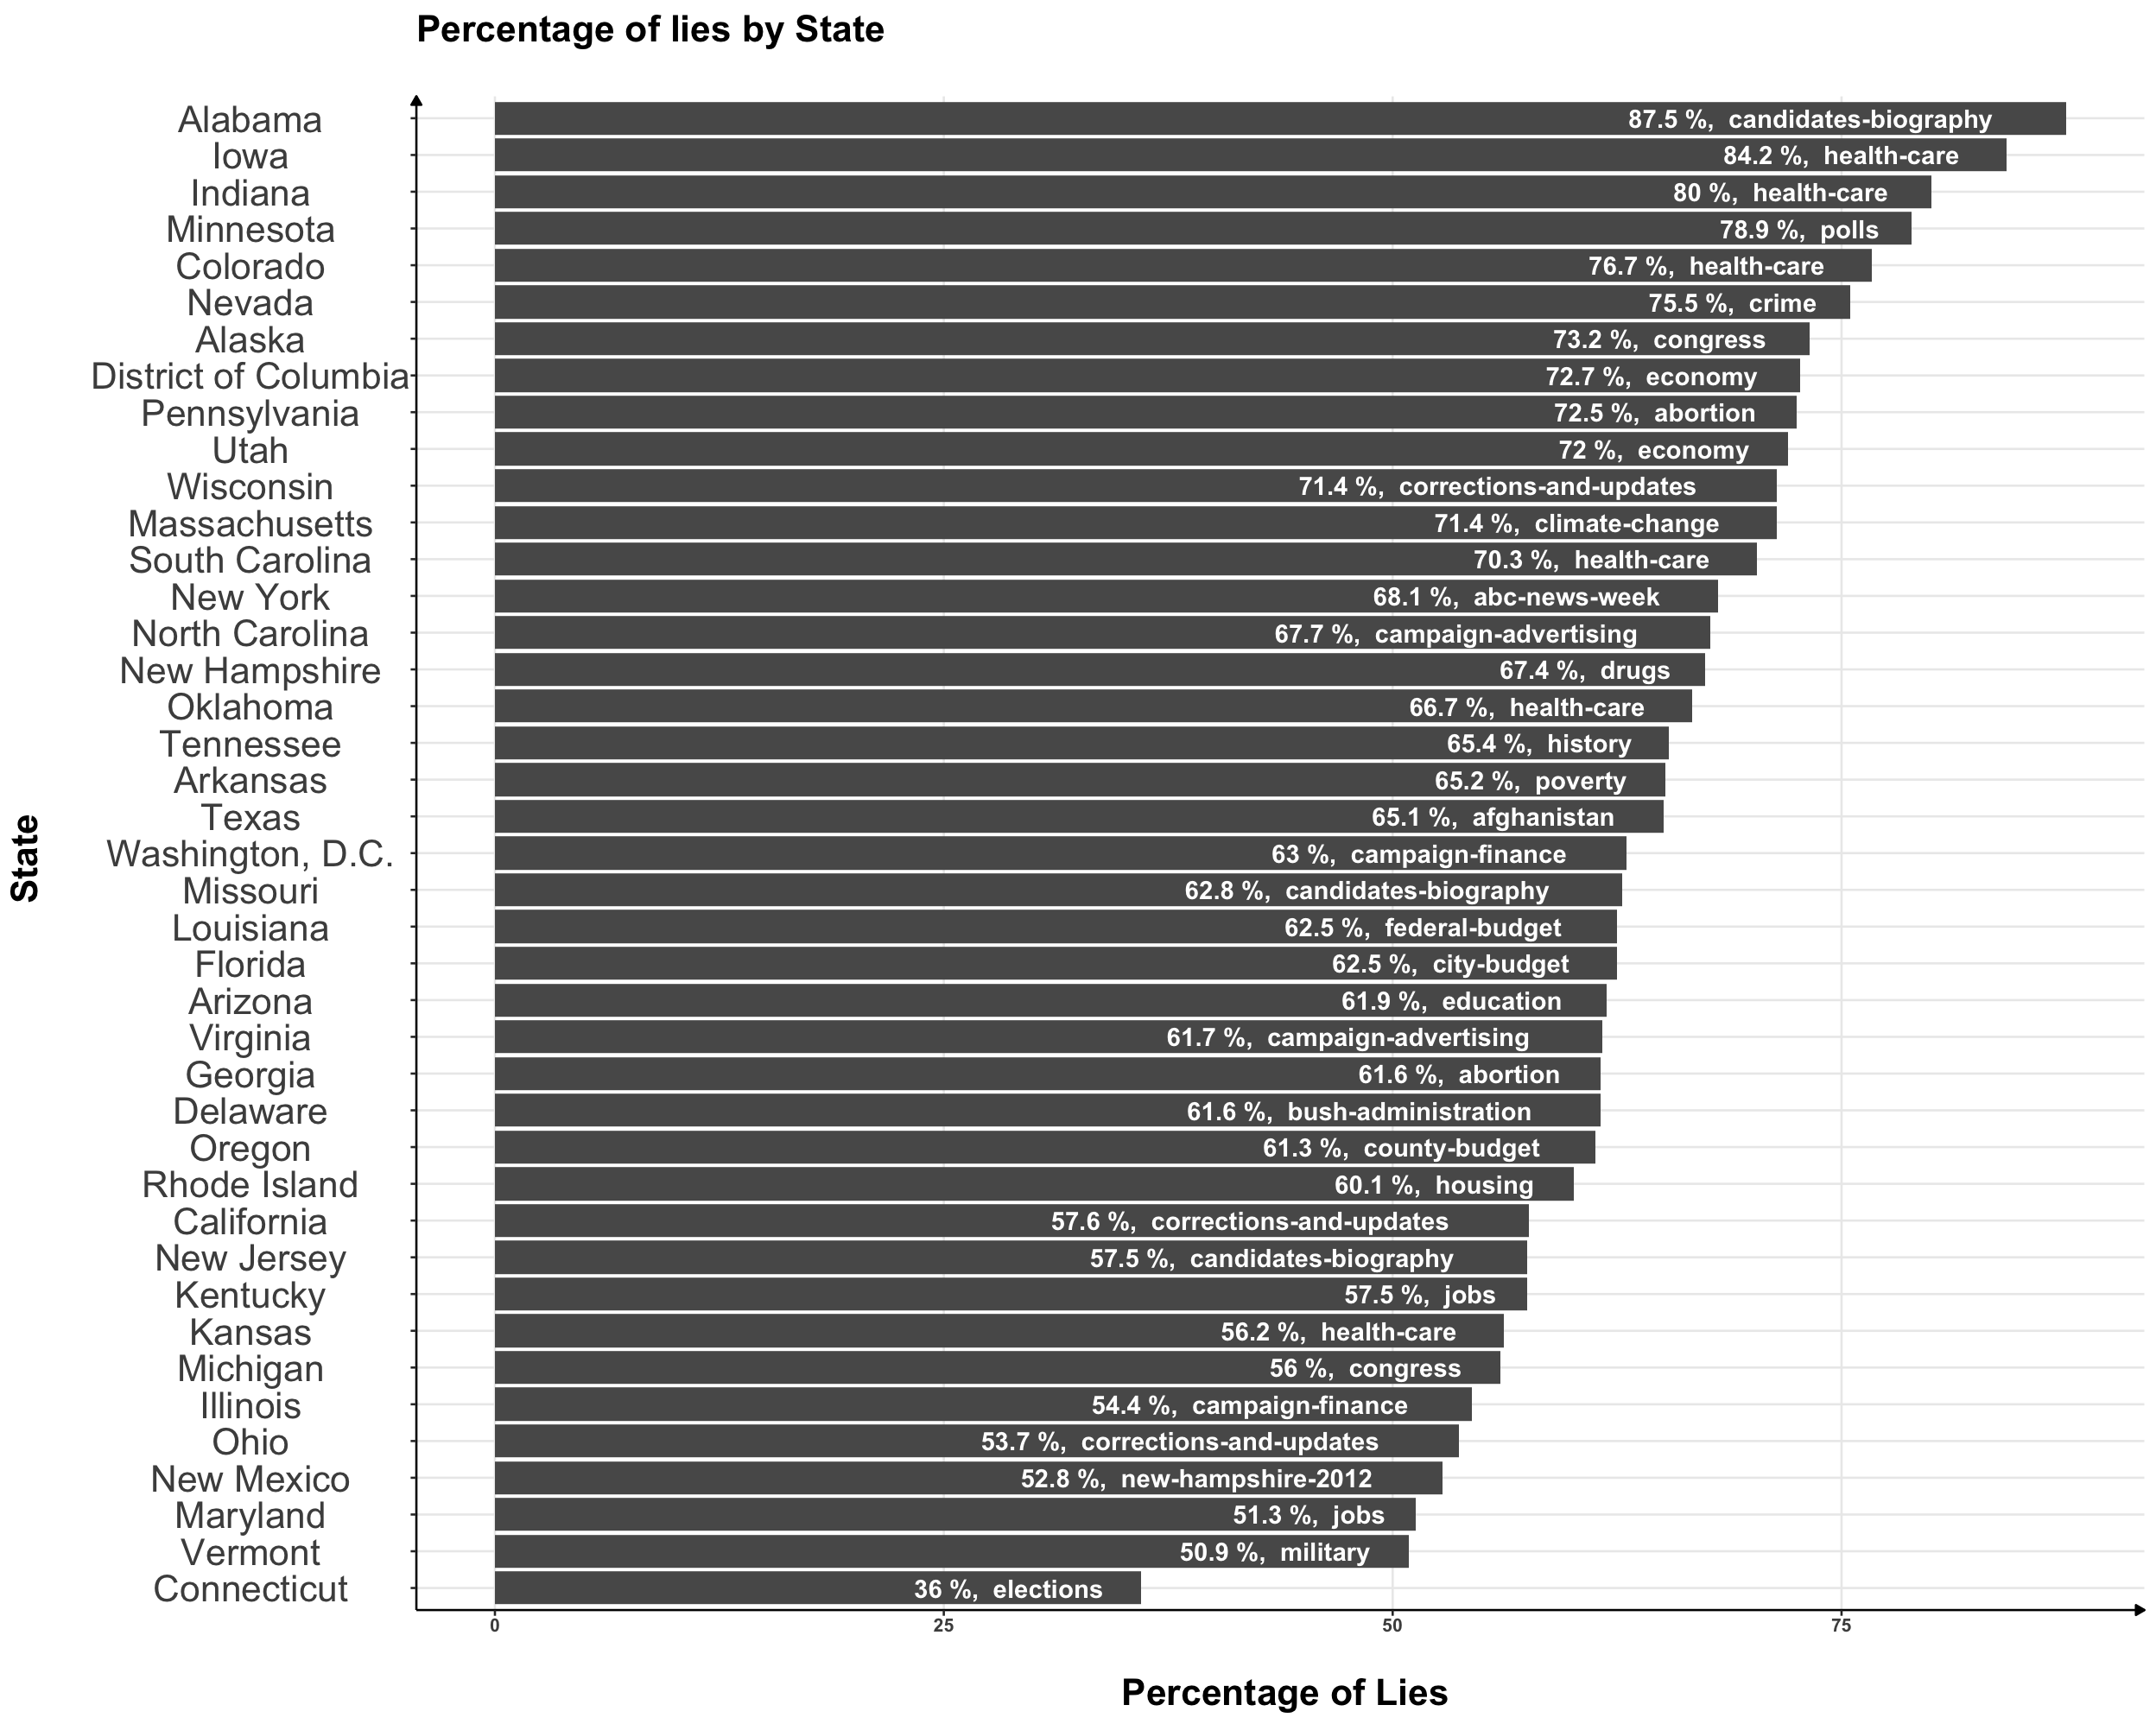
Observation from the Graphs Note: news reports that are labelled with pants-on-fire, false, barely-true, or half-true are considered not factual. Factual news are either mostly-true or true. The legend shows the order of truth values, which we will call the truth spectrum
Alabama is the most misinformative state and Conneticut is the most informative.
Healthcare is the most misinformative subject out of all subjects in the states, with candidates-biography being the second most misinformative subject.
The top 5 most misinformative states are either Southern or Midwestern, while the bottom 3 most misinformative states are located in the Eastern region of the United States
Apart from the top 5 and bottom 3 states, there does not seem to be a particular region associated with misinformation spread by state
Question 9: Distribution of Factual News with respect to state
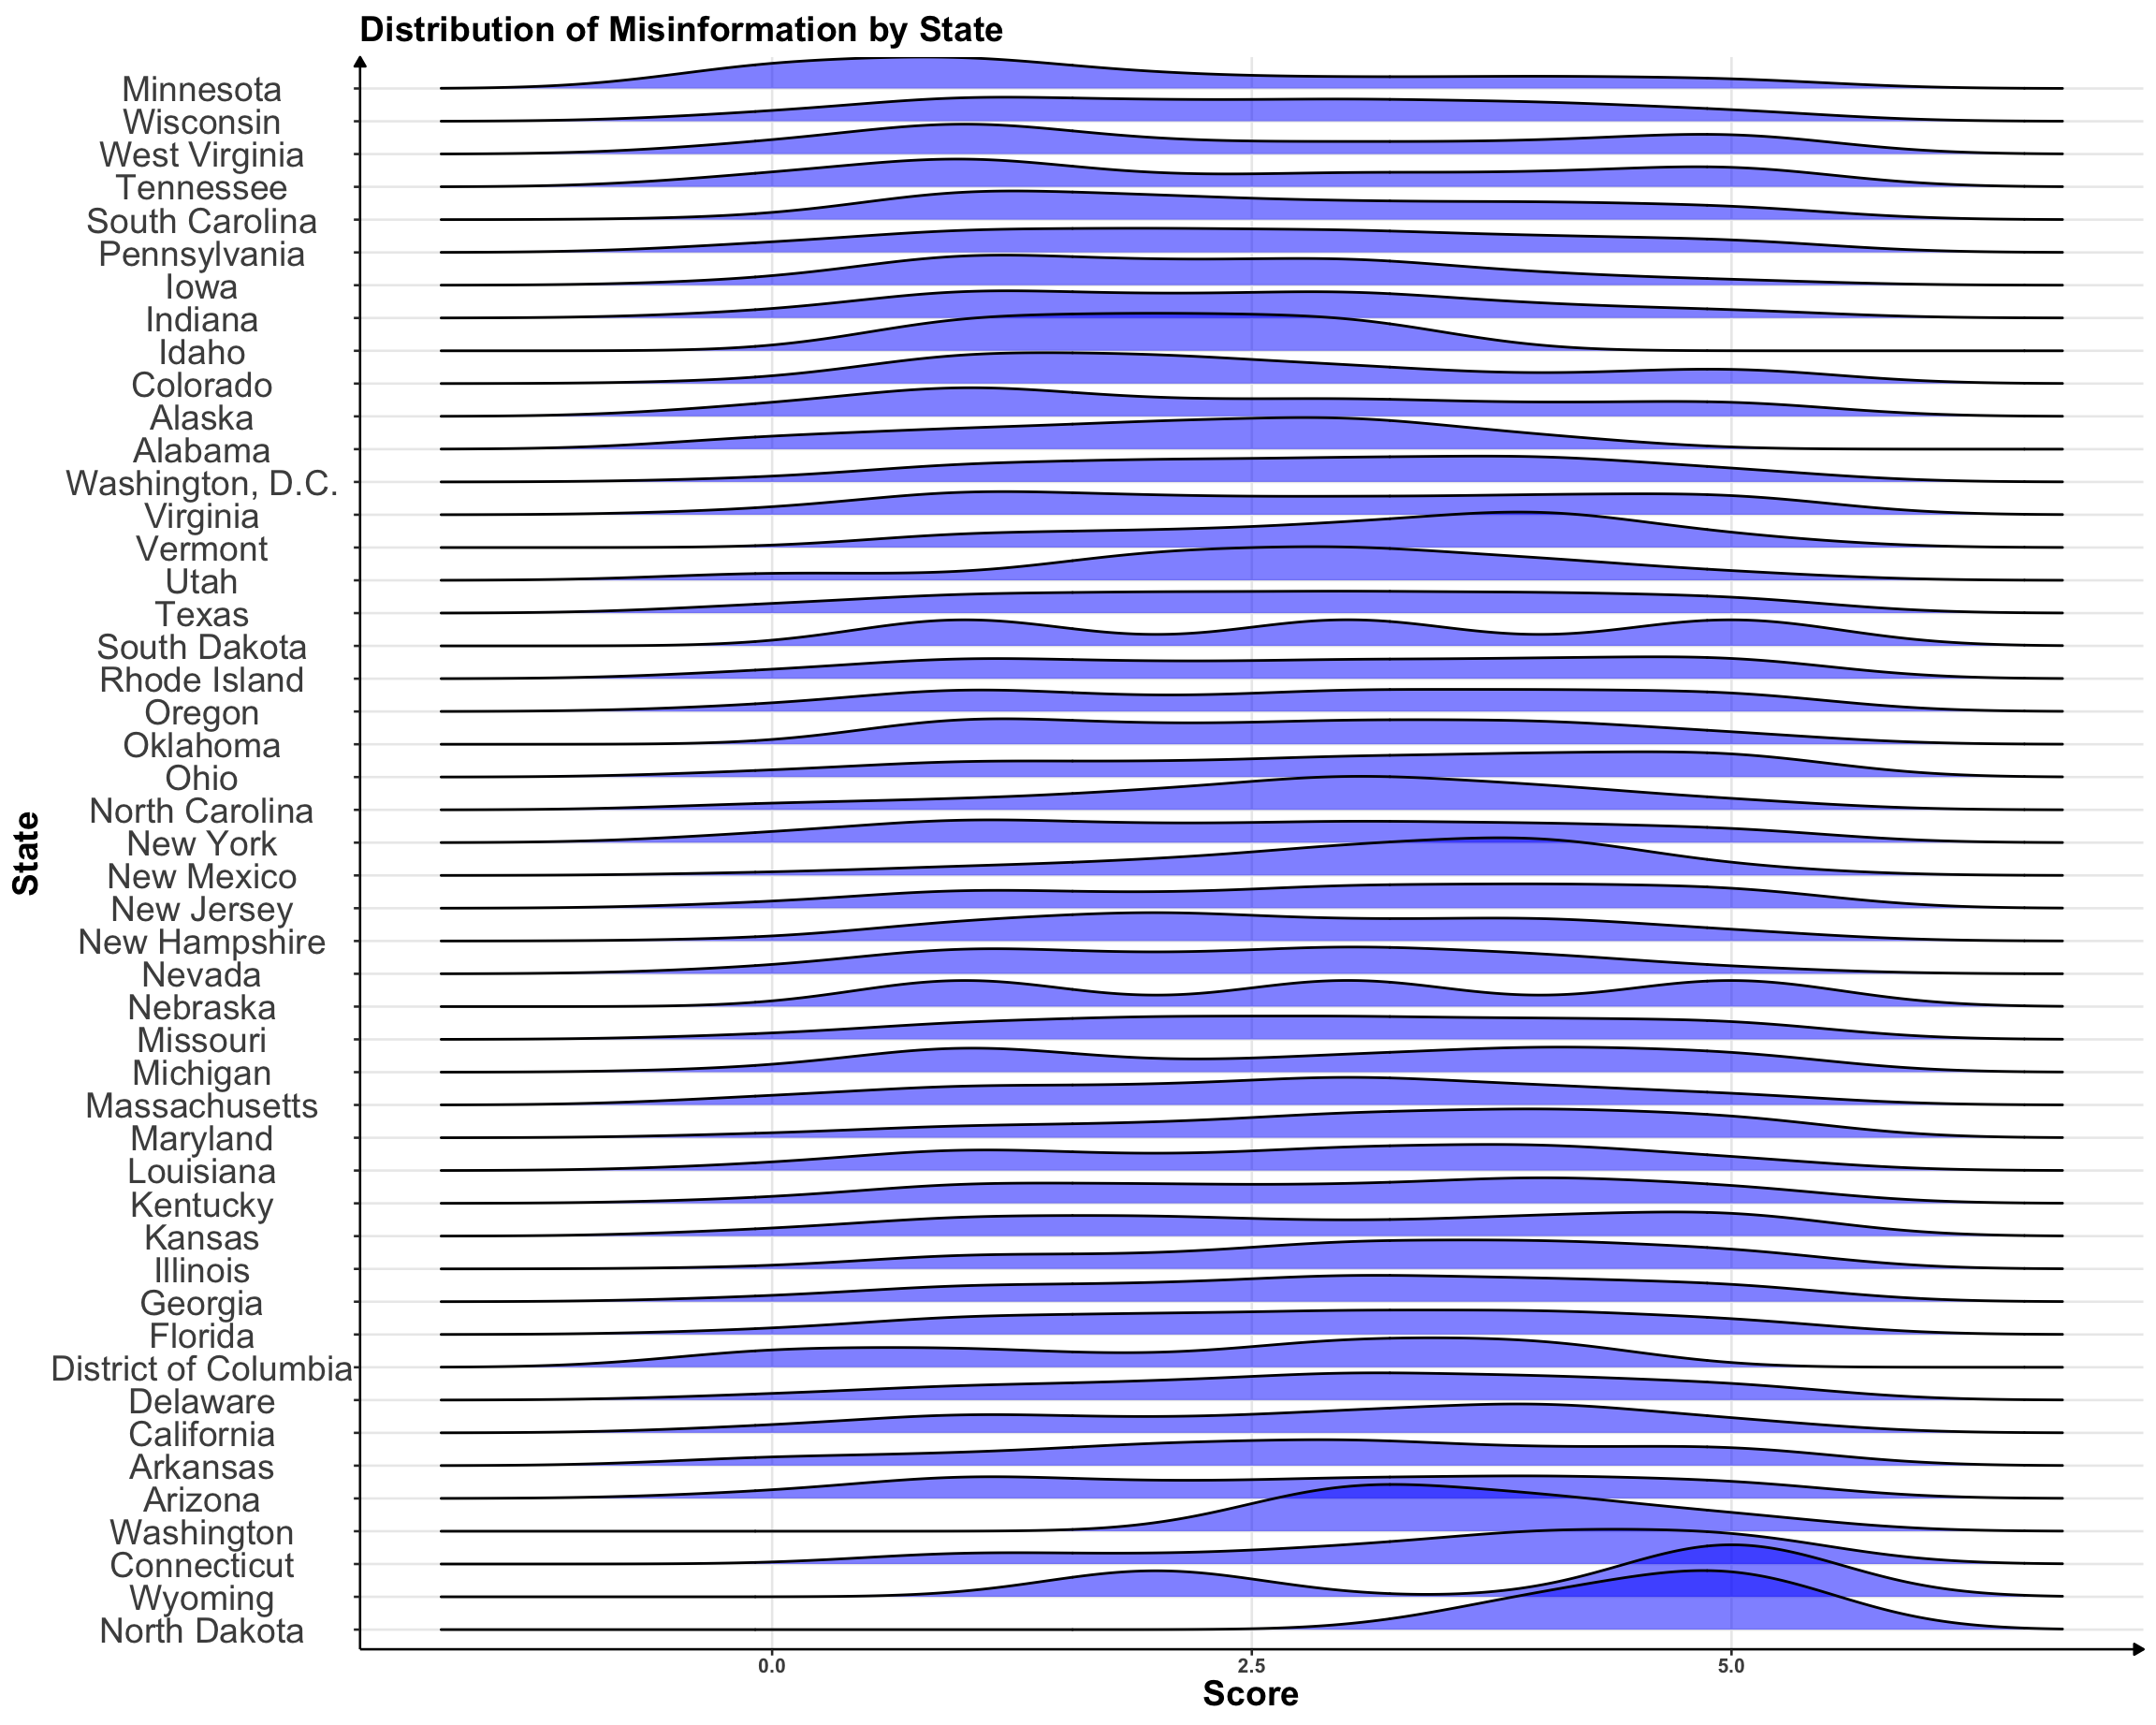
Observation from the Graphs Note: Each label was assigned a score: 0 for “pants-on-fire”, 1 for “false”, 2 for “barely-true”, 3 for “half-true”, 4 for “mostly-true”, and 5 for “true”
Most states either have a very flat, bimodal, or multimodal distribution. This indicates that most states have news reports that range through multiple points in the truth spectrum, which is consistent with the graph in question 7.
The top 2 most honest states by median (Wyoming and North Dakota in this case) have most of their distribution around the score of 5.
North Dakota is consistently true with their news, while Washington is consistently half-true with their news
Question 10: Which subject has the most concentrated fake news?
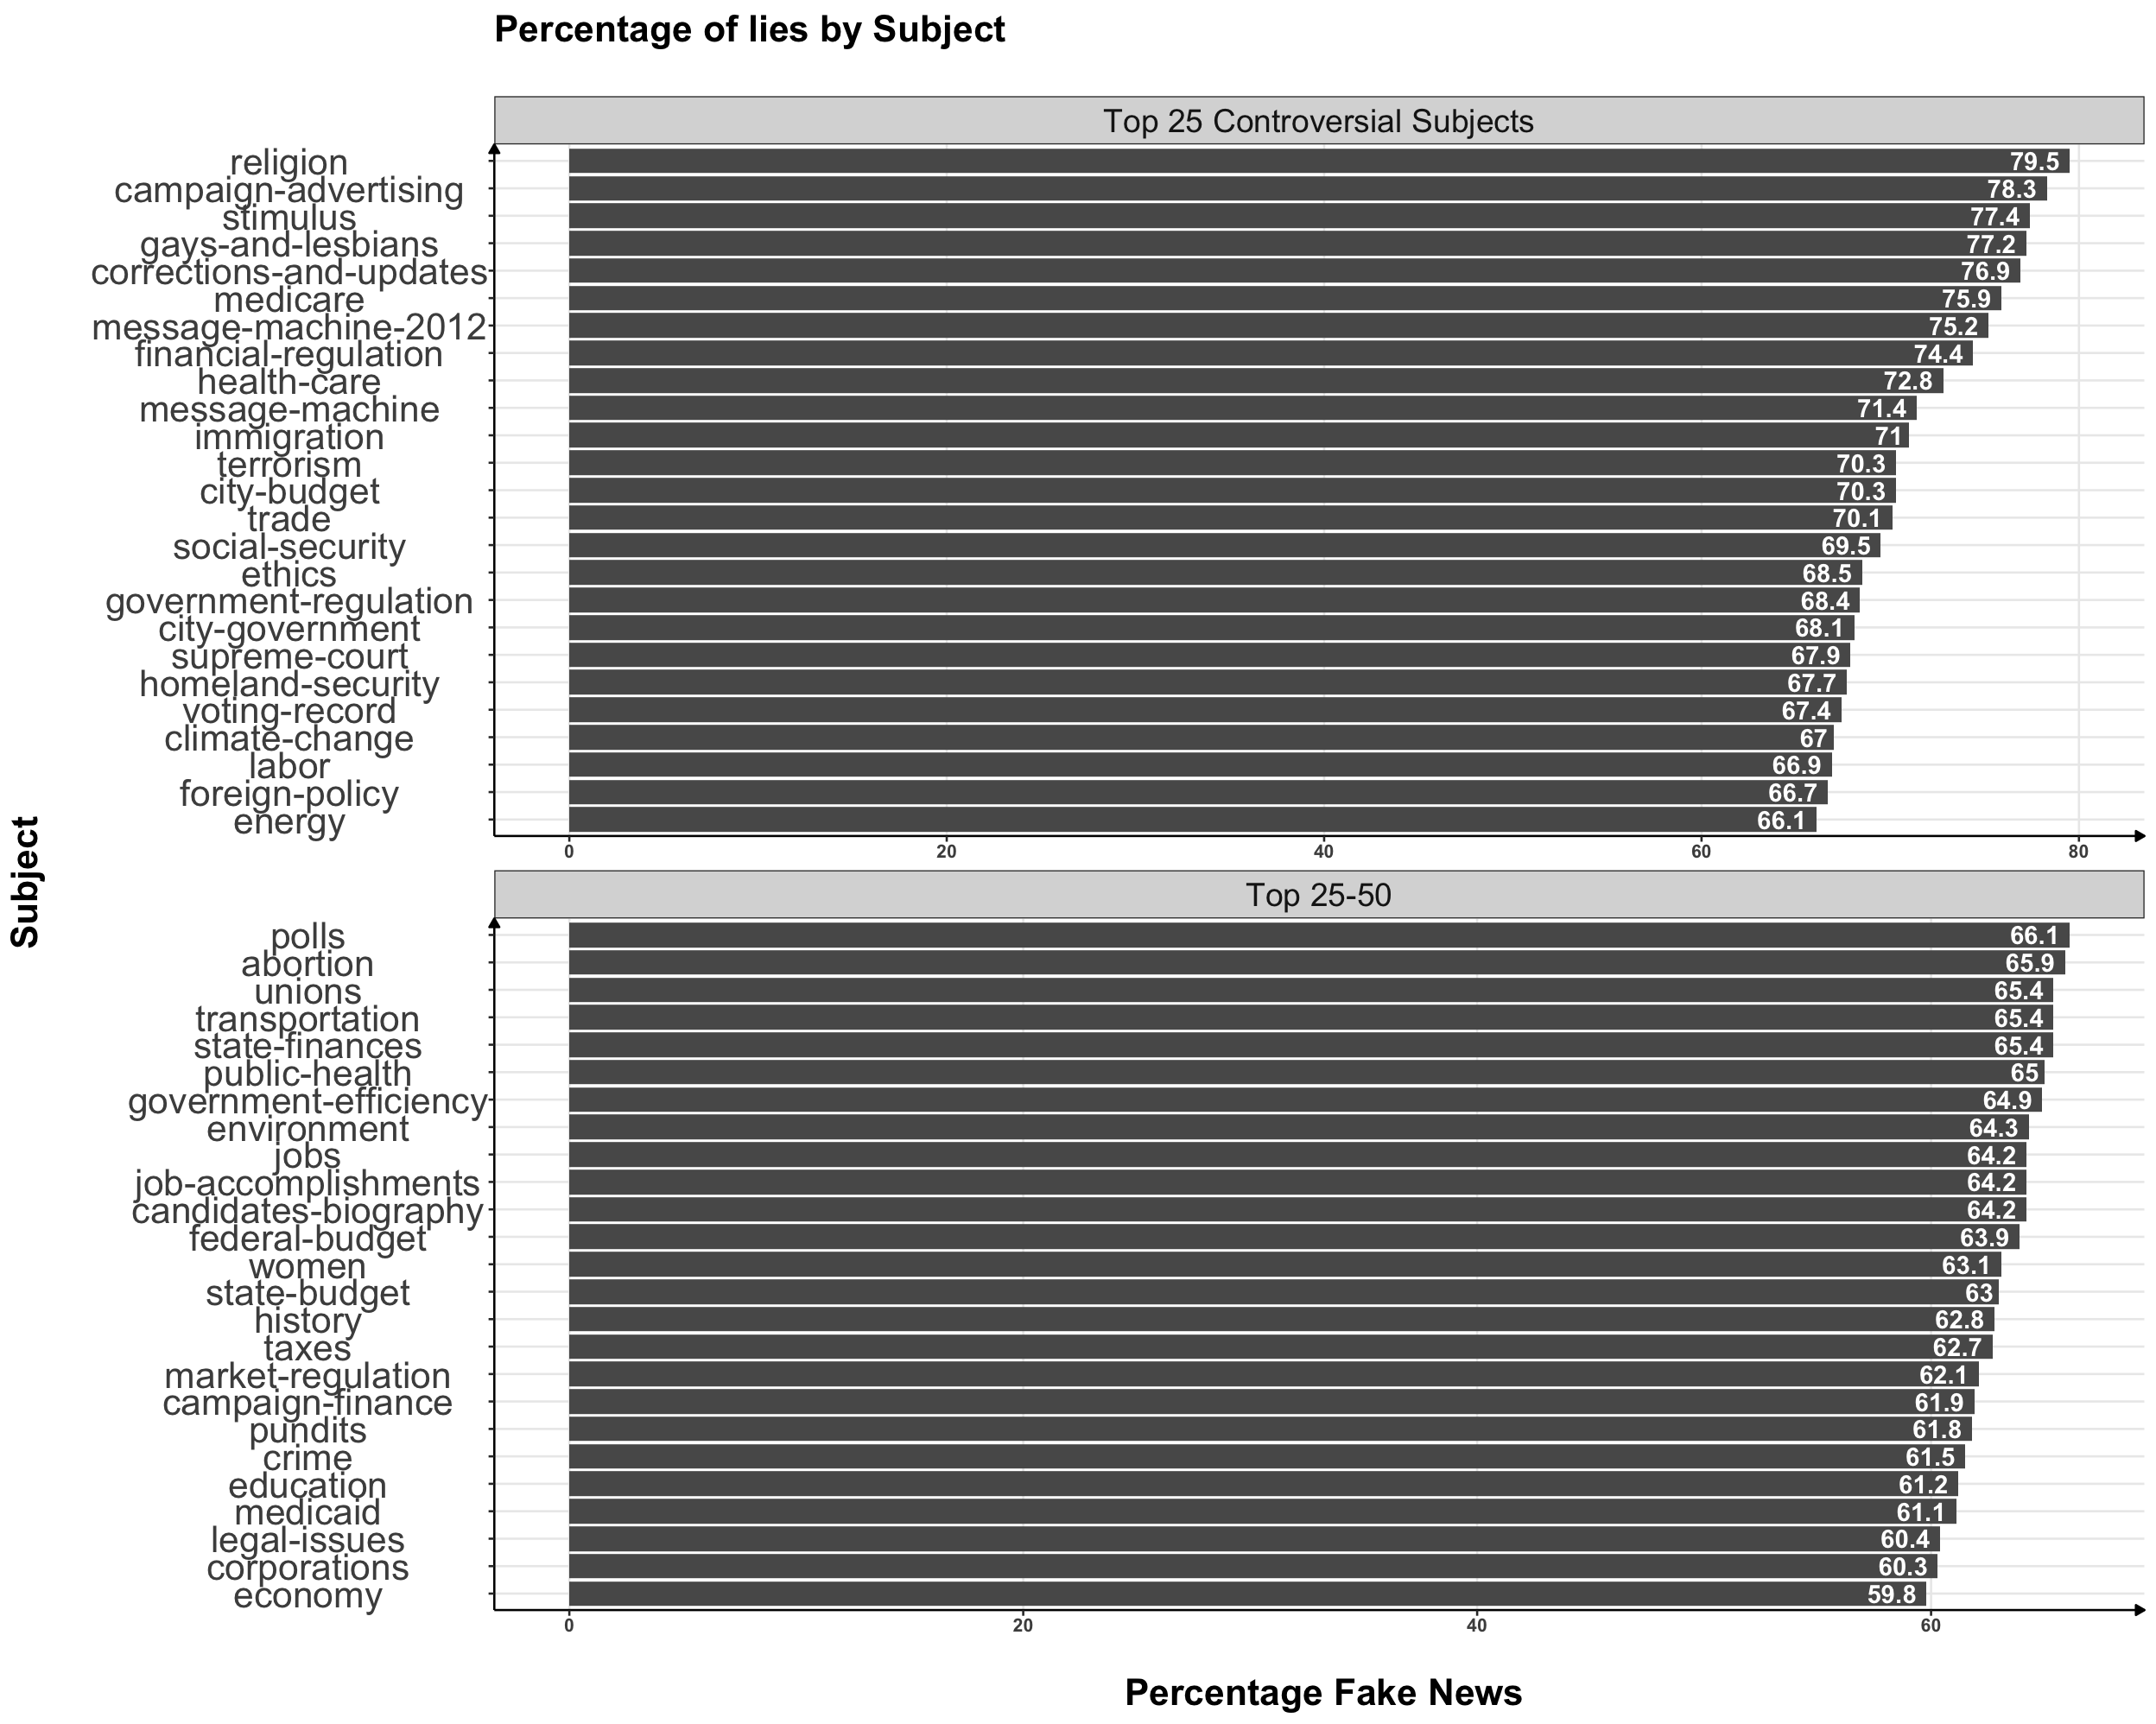
Observation from the Graphs Note: a news report is considered fake news if it is either pants-on-fire, false, barely-true, or half-true
Religion has the most misinformation spread about it
Most of the controversial subjects present in question 8 are also present in this graph (and are therefor the top 50 most misinformative subjects)
Like one would expect, most of the subjects present in this graph are related to social issues or political topics.
Question 11: Origin of Fake Vs Factual News with respect to Venue, Party & Job Title
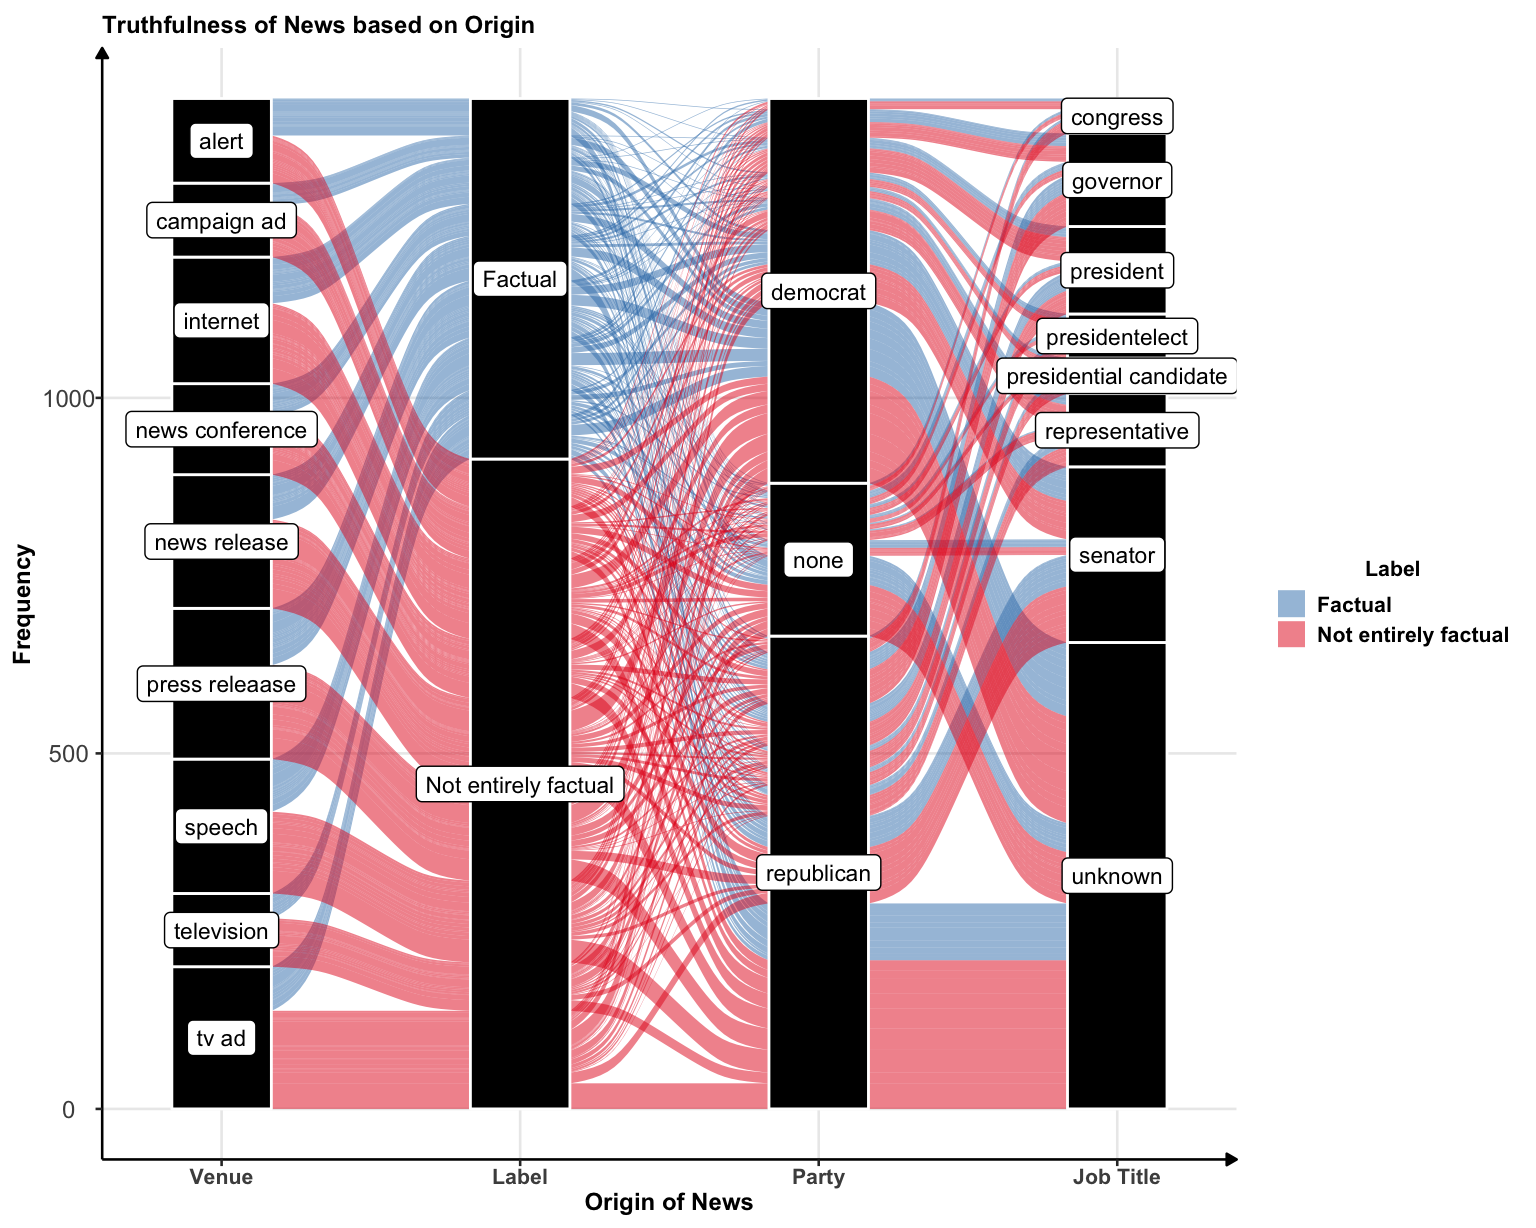
Observation from the Graphs
Fake news is present no matter what venue, party, or type of speaker it originates from
For every type of venue, party, and job title, at least half of the news reports are not entirely true
As seen in the Label column, most news reports made in this graph are not entirely true