Chapter 4 Missing values
Below are some key observations with respect to Missing Values in the dataset.
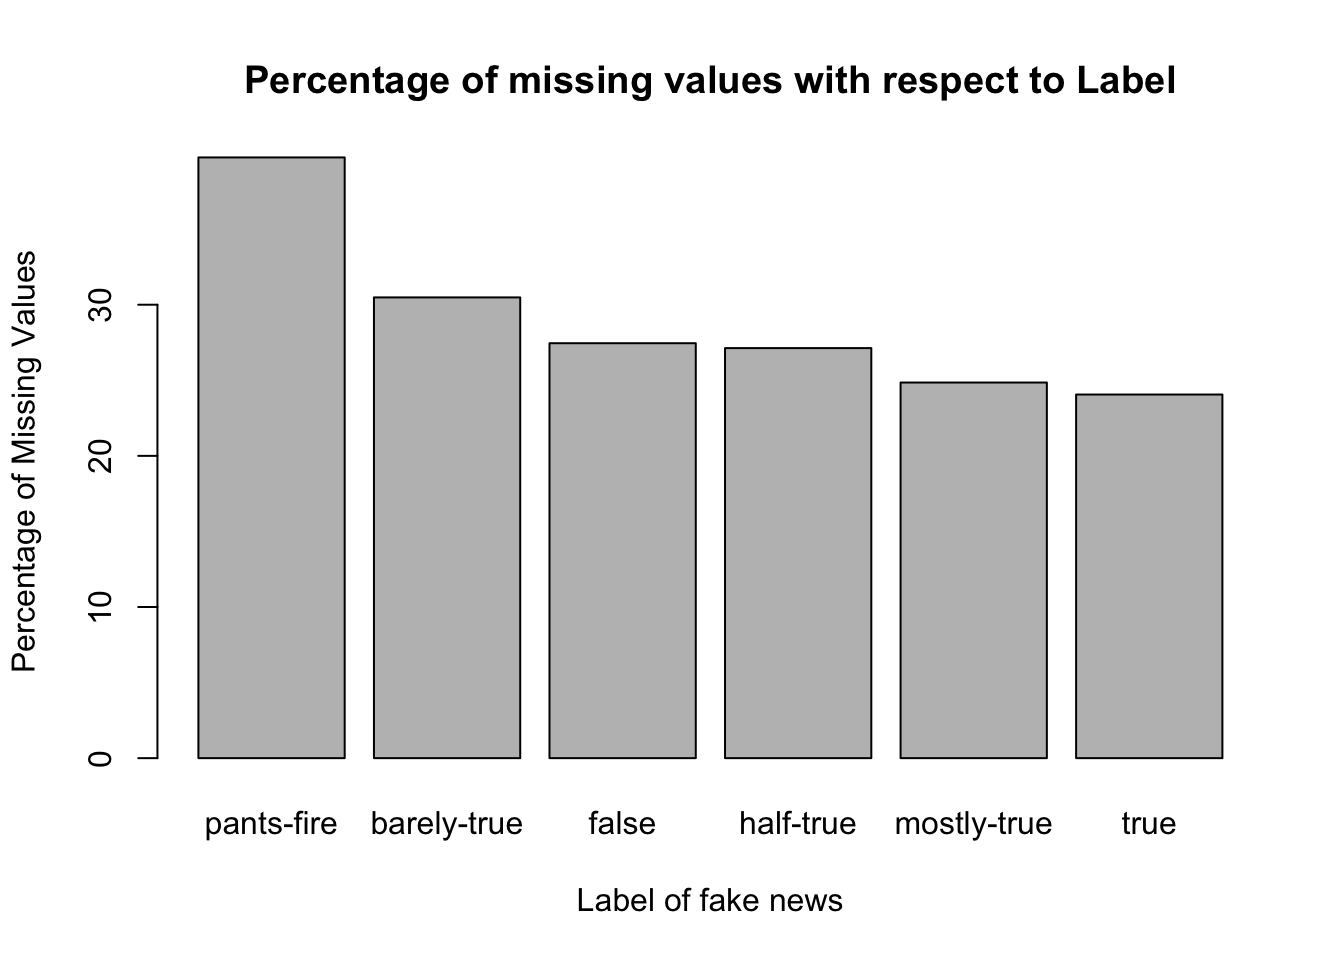
Missing values by column for the Liar dataset
##     Speaker Job Title            State Info        Venue/Location
##                  3170                  2446                   110
##            Subject(s)               Speaker The Party Affiliation
##                     2                     2                     2
##    Barely True Counts          False Counts      Half True Counts
##                     2                     2                     2
##    Mostly True Counts  Pants on Fire Counts                    ID
##                     2                     2                     0
##                 Label             Statement
##                     0                     0
It is important to note that the Label column (independent feature) doesn’t have missing values in the dataset.
Most of the columns have 2 missing values, which after taking a closer look belongs to ID’s 5872 and 8180
Speaker Job Title has the most missing values - 3170 missing entries
Top 30 row-id having maximum missing values
##  5872  8180   921  1137  1274  2584  2834  3622  3645  4020  5845  6058  6279
##    11    11     3     3     3     3     3     3     3     3     3     3     3
##  6553  6603  8125  8172  8222  8952  9323  9583  9752 10096 10434 10667 10871
##     3     3     3     3     3     3     3     3     3     3     3     3     3
## 11120     3     8    13
## 3 2 2 2- Maximum number of columns with missing values in a given row are 11. For examples Id’s like 5872, 8180 etc. have 11 columns with missing values.
Heatmap
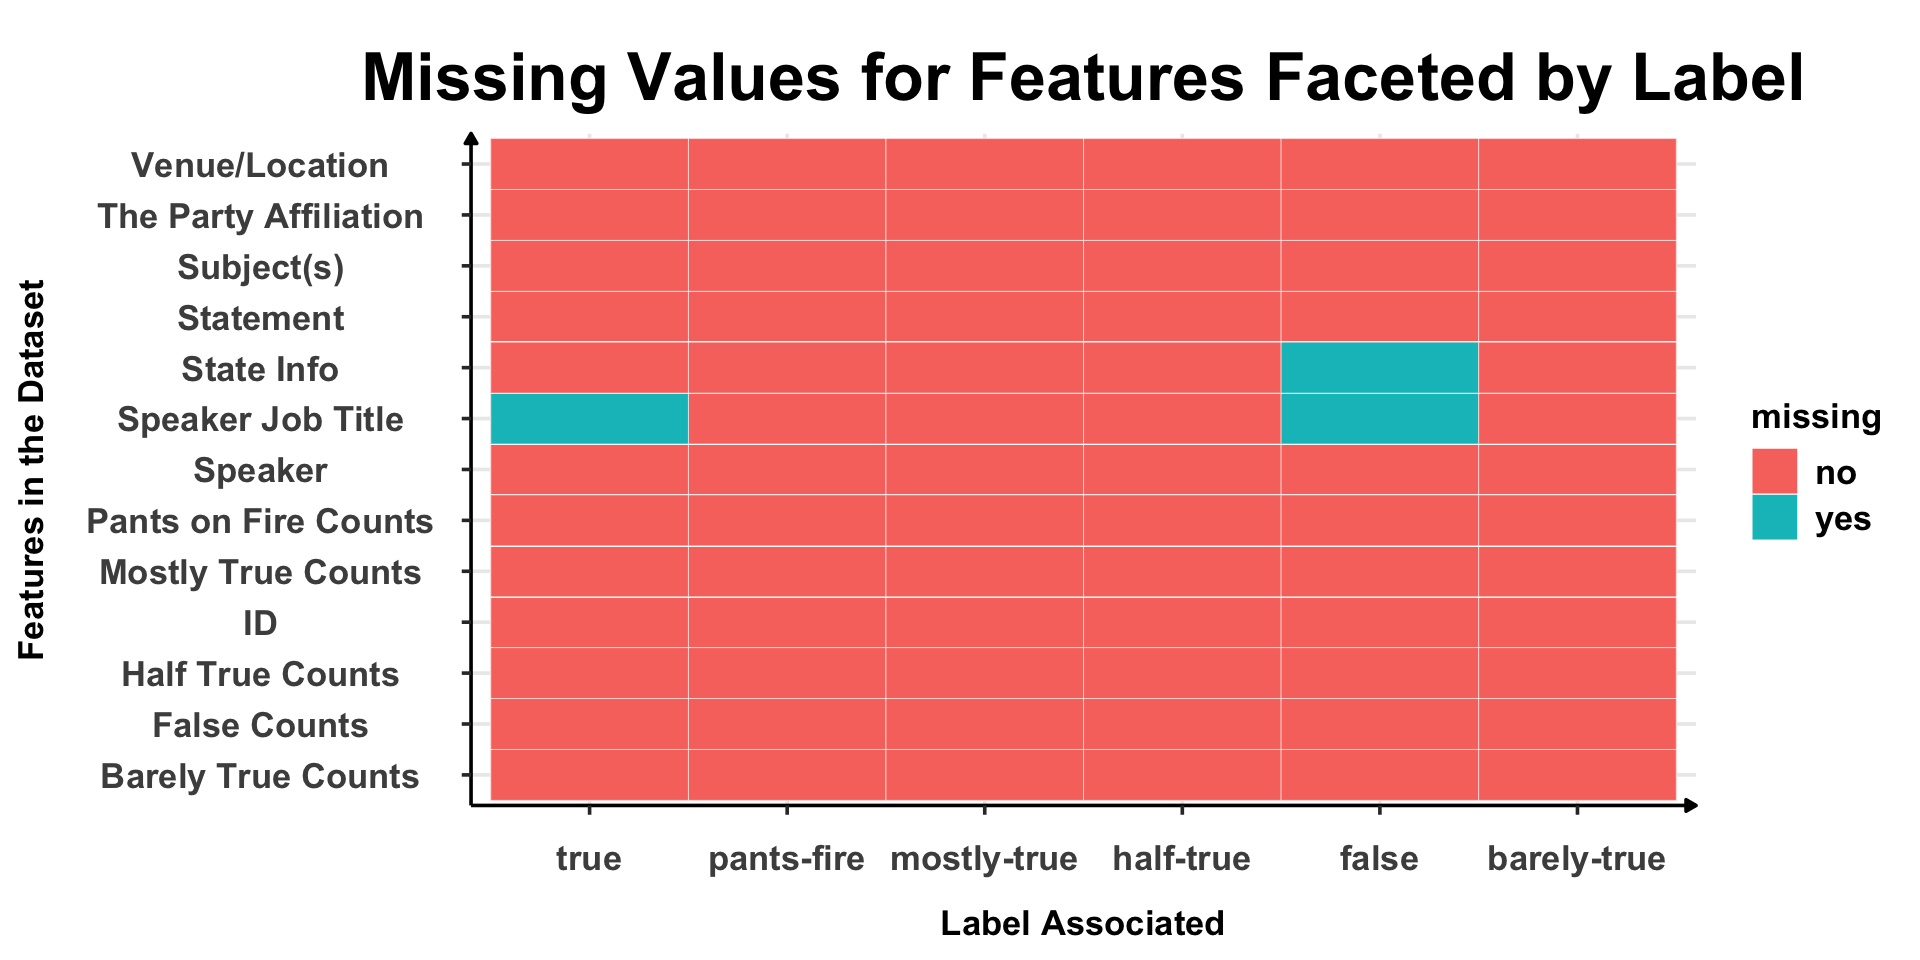
Since we noticed that “Speaker Job Title” and “State Info” had maximum missing values, we used heatmaps to see if we can observe any pattern. Below are the observed patterns :-
For “Speaker Job Title”, True & False Staements were completely missing.
For “State Info” feature, False Statements were completely missing.
Missing proportions
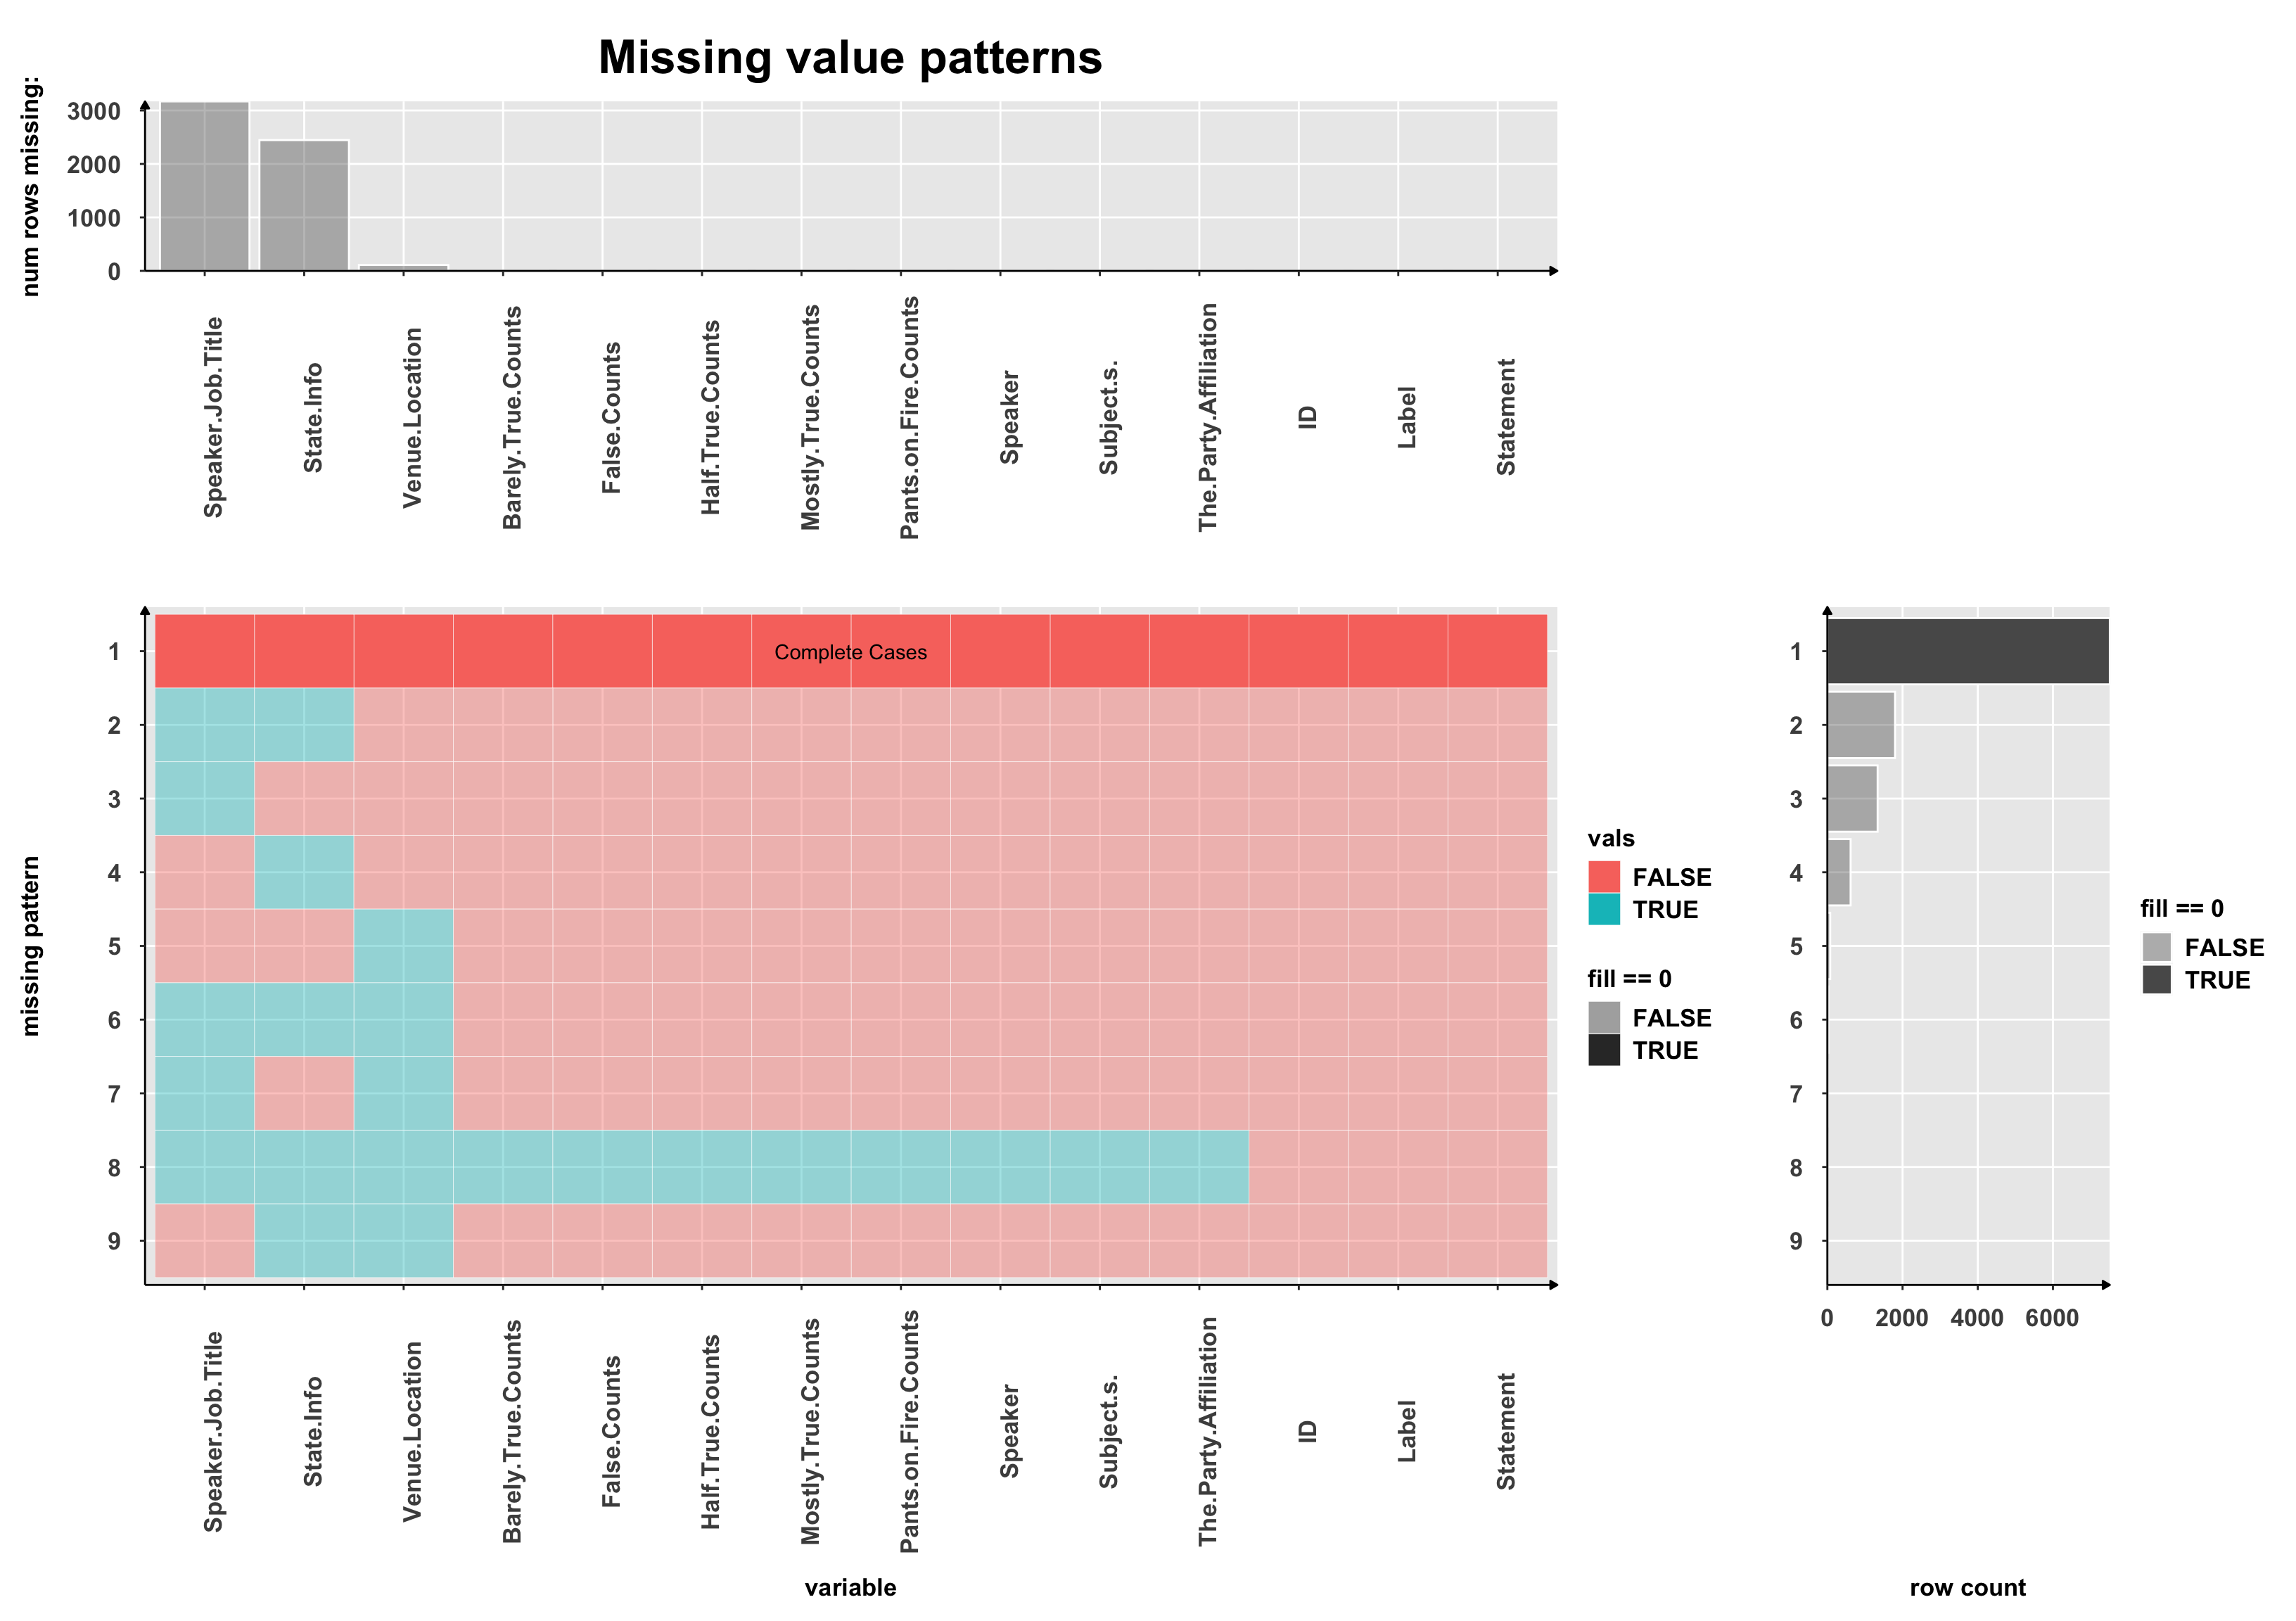
We created this missing values plots to identify any patterns for the rows.
- The majority of the rows have no missing values
- Roughly 1800 rows have Speaker Job Title and State Info missing
- Over 1000 rows only have Speaker Job Title missing, and roughly 500 rows only have State Info missing.
- The rest of the patterns are hardly present.